Lee and Noh: Optimal positive lymph node ratio showing the benefit of postoperative radiotherapy in pathologic N2 non-small cell lung cancer: an exploratory study using the Surveillance, Epidemiology, and End Results data
Abstract
Purpose
This study aimed to identify the clinical parameters having the beneficial effect of postoperative radiotherapy (PORT) in pathologic N2 (pN2) non-small cell lung cancer (NSCLC) using the Surveillance, Epidemiology, and End Results (SEER) data.
Materials and methods
Among non-metastatic NSCLC patients in the SEER data, we included patients who diagnosed after 2002, who confirmed as pN2 after lobectomy or pneumonectomy, and who coded as underwent PORT or observation. Patients who survived less than 4 months of diagnosis were excluded in consideration of the perioperative mortality. After performing propensity score matching (PSM) on the selected patients, we compared PORT group with surgery alone group. We also performed exploratory subgroup analysis to find patients who could benefit from PORT.
Results
Among the selected 4,456 patients, 1,729 patients received PORT, and 2,727 patients did not. There was no survival benefit of PORT in all patients with pN2 disease (hazard ratio [HR] = 1.03, p = 0.5). In subgroup analyses, the patients with a positive lymph node (LN) ratio of 60%–80% showed the significant benefit of PORT (HR = 0.71, p = 0.002).
Conclusion
PORT did not show the significant survival benefit in patients with pN2 disease after correcting the confoundedness in the SEER data. However, a specific range of LN ratios can be a potential indicator maximizing the survival benefit of PORT.
Keywords: Non-small cell lung carcinoma, Adjuvant radiotherapy, Lymph node ratio, SEER program
Introduction
The use of postoperative radiotherapy (PORT) in patients with pathologic N2 (pN2) non-small cell lung cancer (NSCLC) is controversial. A retrospective study published in 2006 by analyzing the Surveillance, Epidemiology, and End Results (SEER) data found that PORT improved survival in pN2 NSCLC patients [ 1]. However, a similar recent study, updated in 2019, found that PORT did not play a significant role in improving survival [ 2]. Evidence-based clinical practice guidelines published in 2015 suggest that the use of PORT in pN2 NSCLC patients does not improve survival, but it recommends PORT in terms of enhancing local control [ 3]. The PORT meta-analysis published in 2016 found no clear evidence of a worse outcome with PORT in pN2 patients [ 4]. The results of a 3-year analysis published in 2020 by the European multicenter randomized phase 3 study conducted in pN2 NSCLC patients (LungART) showed that disease-free survival was high but not significant in the PORT group compared with the no-PORT group [ 5]. The phase 3 randomized clinical trial results published in 2021 in China also showed that PORT did not improve DFS [ 6]. As described above, the effectiveness of PORT has not currently been validated in pN2 patients. However, we hypothesized that there is a more specific subgroup maximizing the benefit of PORT. This study aimed to identify the potential clinical factors showing the survival benefit of PORT using the SEER data with the method of propensity score matching (PSM).
Materials and Methods
Within the SEER data, we selected NSCLC patients with pN2 disease over 21 years of age diagnosed between 2003–2014. We excluded patients who underwent anything other than lobectomy or pneumonectomy. We also excluded patients with M1 stage or receiving RT other than PORT or having incomplete tumors information (primary tumor size, tumor location and laterality, number of lymph nodes involved, and number of lymph nodes sampled). In addition, to reduce the effect on perioperative mortality, we excluded patients who died within three months of diagnosis. A total of 4,456 patients were selected for analysis by inclusion and exclusion criteria ( Fig. 1). Continuous variables were converted to categoric variables and analyzed: Age at diagnosis (<50, 50–69, or ≥70 years), primary tumor size (≤3.0, 3.1–5.0, or >5.0 cm), the number of lymph nodes involved (1, 2, 3, 4, 5, 6, 7–9, or ≥10), the number of lymph nodes sampled (1–5, 6–10, or ≥10), the ratio of lymph nodes (LN ratio) involved to lymph nodes sampled (0%–20%, 20%–40%, 40%–60%, 60%–80%, 80%–100%). We could not analyze surgical margin status, performance status, timing and regimen of chemotherapy, and radiation therapy techniques (dose, fraction, beam energy, etc.), which are missing in the SEER data.
Overall survival was the primary study endpoint. We implemented the method of PSM to correct the bias of clinical characteristics between the groups with and without PORT. Baseline patient characteristics were evaluated before and after PSM and compared. The Pearson chi-squared test was used to determine unadjusted associations between PORT use and categoric variables of interest. The effect of specific variables on overall survival was analyzed using the Kaplan-Meier method, and significance was evaluated using the log-rank test. Multivariable analysis was performed using Cox proportional hazards models. All data were analyzed using the R version 4.1.1 ( https://cran.r-project.org/). Results were assessed as statistically significant when p < 0.05.
Results
Of the 4,456 pN2 NSCLC patients, 2,727 (61%) did not receive PORT, and 1,729 (39%) received PORT. When the entire patient group was grouped by PORT use, there was an imbalance in patient baseline characteristics ( Table 1). The PORT group tended to be younger (p < 0.001), and a higher proportion of marriages (p = 0.001). The PORT group tended to be a higher proportion of primary lesions on the right side (p = 0.002) and a higher proportion of tumors other than the lower lobe (p = 0.010). In the PORT group, the number of affected nodes was high (p < 0.001), the LN ratio was high (p < 0.001), the ratio of lobectomy was high (p = 0.028), and the ratio of chemotherapy was high (p < 0.001). However, after PSM, all baseline characteristics except the LN ratio were well-balanced. The 5-year overall survival rate for all pN2 NSCLC patients was 36.6%. Prior to PSM, there was no significant difference in overall survival when stratified with PORT use (hazard ratio [HR] = 0.96; 95% confidence interval [CI], 0.89–1.04; p = 0.281) ( Fig. 2A). After PSM, there was no significant difference in overall survival when stratified with PORT use (HR = 1.03; 95% CI, 0.95–1.13; p = 0.459) ( Fig. 2B). Univariable and multivariable analyzes were performed on variables considered clinically effective ( Table 2). Older age, male gender, larger primary tumor size, higher LN ratio, and use of pneumonectomy, and no use of chemotherapy were significantly associated with worse prognosis. The exploratory subgroup analyses were performed after PSM ( Fig. 3). Survival improvement after PORT was found in the patient group with the LN ratio of 60%–80% (HR = 0.71; 95% CI, 0.56–0.91; p=0.006). There were 234 no-PORT patients and 223 PORT patients in this subgroup. Additional survival analyses were performed for this group and the results confirmed that PORT has a survival benefit for this group, both before (HR = 0.70; 95% CI, 0.56–0.87; p=0.001) ( Fig. 4A) and after PSM (HR = 0.71; 95% CI, 0.56–0.88; p=0.002) ( Fig. 4B).
Discussion and Conclusion
In this SEER analysis, we found that the use of PORT did not affect survival in patients with pN2 disease. However, through exploratory subgroup analysis, the results showed that PORT could improve the survival rate in patients with an LN ratio of 60%–80%.
Previous SEER analysis studies have investigated the relationship between the LN ratio and the PORT effect in pN2 NSCLC patients. One study found that PORT improved survival in patients with LN ratio of 0.5 or higher (HR = 0.91; 95% CI, 0.84–0.97; p = 0.01) [ 7]. Another study divided the LN ratio into four groups (<12.5%, 12.5%–24.9%, 25%–49.9%, ≥50%) and found that PORT improved survival in patients with an LN ratio greater than 50% (HR = 0.78; 95% CI, 0.67–0.90; p = 0.001) [ 8]. In this study, we also performed an analysis of the effects of PORT in patients with an LN ratio ≥50% ( Supplementary Fig. S1). PORT has a survival benefit for this group, both before (HR = 0.83; 95% CI, 0.72–0.94; p = 0.004) ( Supplementary Fig. S1A) and after PSM (HR = 0.86; 95% CI, 0.75–0.98; p = 0.030) ( Supplementary Fig. S1B). However, by analyzing the LN ratio by dividing it into 20% units without following the previous studies, more useful information about the relationship between the LN ratio and PORT effect was provided compared to previous studies. We also performed survival analysis on patients with an LN ratio of 0%–60% and LN ratio >80% ( Supplementary Figs. S2, S3), and found that only patients with an LN ratio of 60%–80% had a survival benefit of PORT. As confirmed by the multivariable analysis of this study, the higher the LN ratio, the lower the survival rate. However, in this study, the effect of PORT did not increase as the LN ratio increased. In 0%–60%, PORT had no survival benefit, whereas PORT had a survival benefit in 60%–80%. But at 80%–100%, the survival benefit of PORT disappeared again. We can explain these results in terms of the risk and benefit of PORT. A previous meta-analysis study showed that PORT enhances local control in NSCLC [ 9, 10], but cardiopulmonary toxicity of PORT is also evident [ 11, 12]. The LN ratio correlates with locoregional tumor burden. Therefore, the local control effect can increase as the LN ratio increases. At low LN ratios, the local control effect of PORT is not more significant than cardiopulmonary toxicity due to PORT, and it can lead to no survival benefit of PORT. However, at a moderately high LN ratio, the local control effect of PORT is much higher than toxicity, and it can lead to an increase in the survival rate. At very high LN ratios, local control effects beyond toxicity may occur due to PORT but do not lead to survival benefits. These findings implied that local PORT was not helpful when the disease had already entered the systemic stage. A prospective study is warranted to prove the relationship between the LN ratio and the benefit of PORT. Limitations of this study are retrospective characteristics and lack of information. SEER data does not provide patient characteristics such as surgical margin status, performance status, and detailed information of dissected lymph nodes (location, size, and characteristics), radiation therapy (dose and technique), chemotherapy (regimen, treatment implementation method [neoadjuvant, adjuvant] and sequence information with RT [sequential, concurrent]). The difference from several previous SEER studies on pN2 NSCLC [ 1, 2, 13, 14] is that this study selected only more recent patients to reflect the results of developed diagnosis and treatment techniques and applied the PSM to complement the limitations of retrospective studies. In conclusion, our study found PORT had no significant effect on survival in all pN2 NSCLC patients. However, PORT improves survival in patients with a positive to sampled lymph node ratio of 60%–80%. A prospective study that can prove the relationship between the LN ratio and the PORT effect is warranted.
Supplementary Materials
Fig. S1.
Overall survival for LN ratio ≥50% pN2 NSCLC patients stratified by PORT use (A) before PSM and (B) after PSM. LN, lymph node; NSCLC, non-small cell lung cancer; PORT, postoperative radiation therapy; PSM, propensity score matching.
Fig. S2.
Overall survival for LN ratio 0%–60% pN2 NSCLC patients stratified by PORT use (A) before PSM and (B) after PSM. LN, lymph node; NSCLC, non-small cell lung cancer; PORT, postoperative radiation therapy; PSM, propensity score matching.
Fig. S3.
Overall survival for LN ratio >80% pN2 NSCLC patients stratified by PORT use (A) before PSM and (B) after PSM. LN, lymph node; NSCLC, non-small cell lung cancer; PORT, postoperative radiation therapy; PSM, propensity score matching.
Fig. 1.
Selection of patients in the Surveillance, Epidemiology, and End Results (SEER). NSCLC, non-small cell lung cancer; PORT, postoperative radiation therapy. 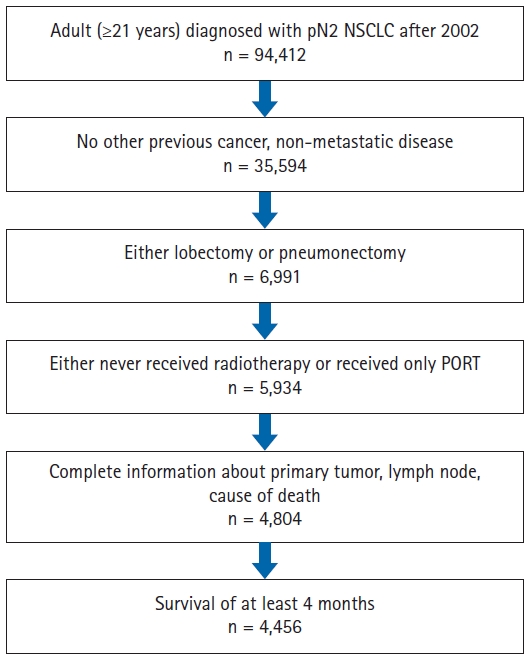
Fig. 2.
Overall survival for pN2 NSCLC patients stratified by PORT use (A) before PSM and (B) after PSM. NSCLC, non-small cell lung cancer; PORT, postoperative radiation therapy; PSM, propensity score matching. 
Fig. 3.
Exploratory subgroup analysis of patient-, tumor-, and treatment-related characteristics after propensity score matching. PORT, postoperative radiation therapy; CI, confidence interval. 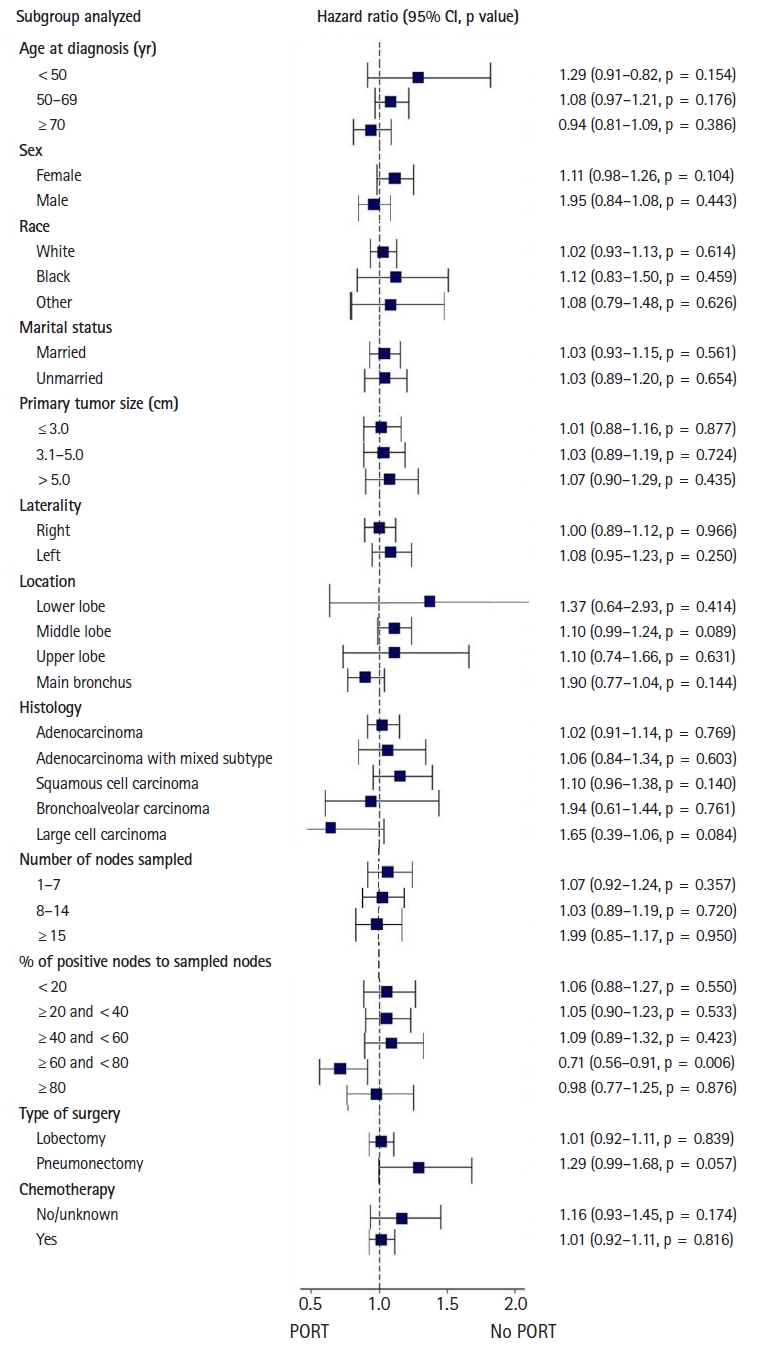
Fig. 4.
Overall survival for LN ratio 60%–80% pN2 NSCLC patients stratified by PORT use (A) before PSM and (B) after PSM. LN, lymph node; NSCLC, non-small cell lung cancer; PORT, postoperative radiation therapy; PSM, propensity score matching. 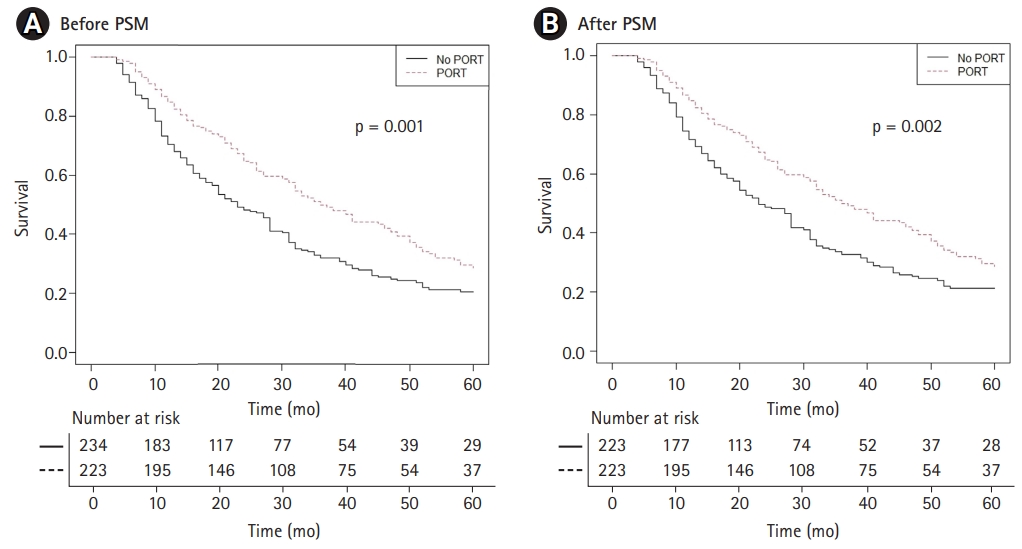
Table 1.
Baseline patient characteristics
|
Before PSM
|
After PSM
|
|
Surgery alone (n = 2727) |
PORT (n = 1729) |
p-value |
Surgery alone (n = 1729) |
PORT (n = 1729) |
p-value |
|
Age at diagnosis (yr) |
|
|
<0.001 |
|
|
0.147 |
|
<50 |
154 (5.6) |
130 (7.5) |
|
122 (7.1) |
130 (7.5) |
|
|
50–69 |
1,458 (53.5) |
1,093 (63.2) |
|
1,048 (60.6) |
1,093 (63.2) |
|
|
≥70 |
1,115 (40.9) |
506 (29.3) |
|
559 (32.3) |
506 (29.3) |
|
|
Sex |
|
|
0.360 |
|
|
0.563 |
|
Female |
1,437 (52.7) |
886 (51.2) |
|
904 (52.3) |
886 (51.2) |
|
|
Male |
1,290 (47.3) |
843 (48.8) |
|
825 (47.7) |
843 (48.8) |
|
|
Race |
|
|
0.718 |
|
|
0.850 |
|
White |
2,231 (81.8) |
1,404 (81.2) |
|
1,416 (81.9) |
1,404 (81.2) |
|
|
Black |
262 (9.6) |
160 (9.3) |
|
163 (9.4) |
160 (9.3) |
|
|
Other |
234 (8.6) |
165 (9.5) |
|
150 (8.7) |
165 (9.5) |
|
|
Marital status |
|
|
0.001 |
|
|
0.753 |
|
Married |
1,593 (58.4) |
1,103 (63.8) |
|
1,082 (62.6) |
1,103 (63.8) |
|
|
Unmarried |
1,064 (39.0) |
593 (34.3) |
|
614 (35.5) |
593 (34.3) |
|
|
Unknown |
70 (2.6) |
33 (1.9) |
|
33 (1.9) |
33 (1.9) |
|
|
Primary tumor size (cm) |
|
|
0.264 |
|
|
0.948 |
|
≤3.0 |
1,235 (45.3) |
766 (44.3) |
|
768 (44.4) |
766 (44.3) |
|
|
3.1–5.0 |
897 (32.9) |
608 (35.2) |
|
600 (34.7) |
608 (35.2) |
|
|
>5.0 |
595 (21.8) |
355 (20.5) |
|
361 (20.9) |
355 (20.5) |
|
|
Laterality |
|
|
0.002 |
|
|
0.132 |
|
Right |
1,418 (52.0) |
983 (56.9) |
|
938 (54.3) |
983 (56.9) |
|
|
Left |
1,309 (48.0) |
746 (43.1) |
|
791 (45.7) |
746 (43.1) |
|
|
Location |
|
|
0.010 |
|
|
0.430 |
|
Main bronchus |
29 (1.1) |
23 (1.3) |
|
21 (1.2) |
23 (1.3) |
|
|
Upper lobe |
1,583 (58.0) |
1,039 (60.1) |
|
1,044 (60.4) |
1,039 (60.1) |
|
|
Middle lobe |
105 (3.9) |
93 (5.4) |
|
73 (4.2) |
93 (5.4) |
|
|
Lower lobe |
1,010 (37.0) |
574 (33.2) |
|
591 (34.2) |
574 (33.2) |
|
|
Histology |
|
|
0.150 |
|
|
0.989 |
|
Adenocarcinoma |
1,479 (54.2) |
997 (57.7) |
|
993 (57.4) |
997 (57.7) |
|
|
Adenocarcinoma with mixed subtype |
408 (15.0) |
258 (14.9) |
|
269 (15.6) |
258 (14.9) |
|
|
Squamous cell carcinoma |
636 (23.3) |
365 (21.1) |
|
361 (20.9) |
365 (21.1) |
|
|
Bronchoalveolar carcinoma |
111 (4.1) |
57 (3.3) |
|
55 (3.2) |
57 (3.3) |
|
|
Large cell carcinoma |
93 (3.4) |
52 (3.0) |
|
51 (2.9) |
52 (3.0) |
|
|
Stage |
|
|
0.215 |
|
|
0.758 |
|
IIIA |
2,415 (88.6) |
1,509 (87.3) |
|
1,516 (87.7) |
1,509 (87.3) |
|
|
IIIB |
312 (11.4) |
220 (12.7) |
|
213 (12.3) |
220 (12.7) |
|
|
Tumor stage |
|
|
0.104 |
|
|
0.604 |
|
1 |
741 (27.2) |
436 (25.2) |
|
457 (26.4) |
436 (25.2) |
|
|
2 |
1,534 (56.3) |
962 (55.6) |
|
964 (55.8) |
962 (55.6) |
|
|
3 |
140 (5.1) |
111 (6.4) |
|
95 (5.5) |
111 (6.4) |
|
|
4 |
312 (11.4) |
220 (12.7) |
|
213 (12.3) |
220 (12.7) |
|
|
Number of nodes involved |
|
|
<0.001 |
|
|
0.435 |
|
1 |
820 (30.1) |
401 (23.2) |
|
449 (26.0) |
401 (23.2) |
|
|
2 |
554 (20.3) |
327 (18.9) |
|
339 (19.6) |
327 (18.9) |
|
|
3 |
408 (15.0) |
272 (15.7) |
|
257 (14.9) |
272 (15.7) |
|
|
4 |
259 (9.5) |
190 (11.0) |
|
179 (10.4) |
190 (11.0) |
|
|
5 |
195 (7.2) |
150 (8.7) |
|
133 (7.7) |
150 (8.7) |
|
|
6 |
133 (4.9) |
91 (5.3) |
|
101 (5.8) |
91 (5.3) |
|
|
7-9 |
207 (7.6) |
171 (9.9) |
|
148 (8.6) |
171 (9.9) |
|
|
≥10 |
151 (5.5) |
127 (7.3) |
|
123 (7.1) |
127 (7.3) |
|
|
Number of nodes sampled |
|
|
0.238 |
|
|
0.172 |
|
1–7 |
861 (31.6) |
588 (34.0) |
|
539 (31.2) |
588 (34.0) |
|
|
8–14 |
1,008 (37.0) |
614 (35.5) |
|
655 (37.9) |
614 (35.5) |
|
|
≥15 |
858 (31.5) |
527 (30.5) |
|
535 (30.9) |
527 (30.5) |
|
|
% of positive nodes to sampled nodes |
|
|
<0.001 |
|
|
0.002 |
|
<20 |
977 (35.8) |
438 (25.3) |
|
523 (30.2) |
438 (25.3) |
|
|
≥20 and <40 |
836 (30.7) |
551 (31.9) |
|
560 (32.4) |
551 (31.9) |
|
|
≥40 and <60 |
439 (16.1) |
319 (18.4) |
|
308 (17.8) |
319 (18.4) |
|
|
≥60 and <80 |
234 (8.6) |
223 (12.9) |
|
175 (10.1) |
223 (12.9) |
|
|
≥80 |
241 (8.8) |
198 (11.5) |
|
163 (9.4) |
198 (11.5) |
|
|
Type of surgery |
|
|
0.028 |
|
|
0.522 |
|
Lobectomy |
2,422 (88.8) |
1,572 (90.9) |
|
1,560 (90.2) |
1,572 (90.9) |
|
|
Pneumonectomy |
305 (11.2) |
157 (9.1) |
|
169 (9.8) |
157 (9.1) |
|
|
Chemotherapy |
|
|
<0.001 |
|
|
1 |
|
No/unknown |
1,088 (39.9) |
219 (12.7) |
|
220 (12.7) |
219 (12.7) |
|
|
Yes |
1,639 (60.1) |
1,510 (87.3) |
|
1,509 (87.3) |
1,510 (87.3) |
|
Table 2.
Univariable and multivariable analyses
|
Univariate
|
Multivariate
|
|
HR |
p-value |
HR |
p-value |
|
Age at diagnosis (yr) |
|
|
|
|
|
<50 |
– |
|
– |
|
|
50–69 |
1.23 (1.03–1.47) |
0.025 |
1.22 (1.01–1.46) |
0.036 |
|
≥70 |
1.84 (1.53–2.22) |
<0.001 |
1.79 (1.48–2.17) |
<0.001 |
|
Sex |
|
|
|
|
|
Female |
– |
|
– |
|
|
Male |
1.26 (1.16–1.38) |
<0.001 |
1.23 (1.12–1.35) |
<0.001 |
|
Race |
|
|
|
|
|
White |
– |
|
– |
|
|
Black |
0.93 (0.80–1.09) |
0.378 |
0.95 (0.81–1.11) |
0.490 |
|
Other |
0.74 (0.63–0.87) |
<0.001 |
0.78 (0.66–0.92) |
0.003 |
|
Marital status |
|
|
|
|
|
Married |
– |
|
– |
|
|
Unmarried |
1.07 (0.98–1.17) |
0.144 |
1.09 (0.99–1.20) |
0.077 |
|
Primary tumor size (cm) |
|
|
|
|
|
≤3.0 |
– |
|
– |
|
|
3.1–5.0 |
1.18 (1.07–1.30) |
0.001 |
1.13 (1.02–1.25) |
0.024 |
|
>5.0 |
1.60 (1.43–1.79) |
<0.001 |
1.52 (1.35–1.71) |
<0.001 |
|
Laterality |
|
|
|
|
|
Right |
– |
|
– |
|
|
Left |
0.98 (0.90–1.07) |
0.710 |
0.97 (0.88–1.06) |
0.454 |
|
Location |
|
|
|
|
|
Lower lobe |
– |
|
– |
|
|
Middle lobe |
0.97 (0.78–1.20) |
0.785 |
1.13 (0.91–1.41) |
0.260 |
|
Upper lobe |
0.89 (0.81–0.97) |
0.013 |
0.97 (0.88–1.07) |
0.556 |
|
Main bronchus |
0.97 (0.66–1.43) |
0.884 |
0.90 (0.60–1.36) |
0.627 |
|
Histology |
|
|
|
|
|
Adenocarcinoma |
– |
|
– |
|
|
Adenocarcinoma with mixed subtype |
1.05 (0.92–1.19) |
0.468 |
1.04 (0.91–1.18) |
0.600 |
|
Squamous cell carcinoma |
1.21 (1.08–1.35) |
0.001 |
1.08 (0.96–1.21) |
0.203 |
|
Bronchoalveolar carcinoma |
1.06 (0.85–1.33) |
0.607 |
1.05 (0.84–1.32) |
0.668 |
|
Large cell carcinoma |
1.08 (0.84–1.38) |
0.569 |
1.05 (0.81–1.35) |
0.710 |
|
Number of nodes sampled |
|
|
|
|
|
1–7 |
– |
|
– |
|
|
8–14 |
0.95 (0.86–1.05) |
0.330 |
1.07 (0.96–1.19) |
0.226 |
|
≥15 |
0.92 (0.83–1.03) |
0.146 |
1.11 (0.98–1.25) |
0.101 |
|
% of positive nodes to sampled nodes |
|
|
|
|
|
<20 |
– |
|
– |
|
|
≥20 and <40 |
1.23 (1.09–1.38) |
0.001 |
1.23 (1.09–1.39) |
0.001 |
|
≥40 and <60 |
1.39 (1.22–1.59) |
<0.001 |
1.42 (1.24–1.63) |
<0.001 |
|
≥60 and <80 |
1.76 (1.52–2.04) |
<0.001 |
1.77 (1.52–2.06) |
<0.001 |
|
≥80 |
1.90 (1.63–2.21) |
<0.001 |
1.92 (1.65–2.24) |
<0.001 |
|
Type of surgery |
|
|
|
|
|
Lobectomy |
– |
|
– |
|
|
Pneumonectomy |
1.26 (1.10–1.45) |
0.001 |
1.23 (1.05–1.43) |
0.009 |
|
Chemotherapy |
|
|
|
|
|
No/unknown |
– |
|
– |
|
|
Yes |
0.67 (0.60–0.76) |
<0.001 |
0.74 (0.66–0.84) |
<0.001 |
|
PORT |
|
|
|
|
|
No |
– |
|
– |
|
|
Yes |
1.03 (0.95–1.13) |
0.458 |
1.01 (0.92–1.10) |
0.869 |
References
1. Lally BE, Zelterman D, Colasanto JM, Haffty BG, Detterbeck FC, Wilson LD. Postoperative radiotherapy for stage II or III non-small-cell lung cancer using the surveillance, epidemiology, and end results database. J Clin Oncol 2006;24:2998–3006.   2. Chen D, Li Y, Jing W, Yu J, Xing L. Postoperative radiotherapy for stage II or III non–small cell lung from 1988 to 2014. J Clin Oncol 2019;37(15_suppl):e20013. 3. Rodrigues G, Choy H, Bradley J, et al. Adjuvant radiation therapy in locally advanced non-small cell lung cancer: executive summary of an American Society for Radiation Oncology (ASTRO) evidence-based clinical practice guideline. Pract Radiat Oncol 2015;5:149–55. 4. Burdett S, Rydzewska L, Tierney J, et al. Postoperative radiotherapy for non-small cell lung cancer. Cochrane Database Syst Rev 2016;10:CD002142. 5. Le Pechoux C, Pourel N, Barlesi F, et al. LBA3_PR: An international randomized trial, comparing post-operative conformal radiotherapy (PORT) to no PORT, in patients with completely resected non-small cell lung cancer (NSCLC) and mediastinal N2 involvement: primary end-point analysis of LungART (IFCT-0503, UK NCRI, SAKK) NCT00410683. Ann Oncol 2020;31(suppl_4):S1142–215. 6. Hui Z, Men Y, Hu C, et al. Effect of postoperative radiotherapy for patients with pIIIA-N2 non-small cell lung cancer after complete resection and adjuvant chemotherapy: the phase 3 PORT-C randomized clinical trial. JAMA Oncol 2021;7:1178–85. 7. Gao F, Li N, Xu Y, Yang G. Effects of postoperative radiotherapy on survival of patients with stage IIIA resected non-small cell lung cancer: analysis of the SEER Database. J Natl Compr Canc Netw 2020;18:718–27. 8. Urban D, Bar J, Solomon B, Ball D. Lymph node ratio may predict the benefit of postoperative radiotherapy in non-small-cell lung cancer. J Thorac Oncol 2013;8:940–6. 9. Billiet C, Decaluwe H, Peeters S, et al. Modern post-operative radiotherapy for stage III non-small cell lung cancer may improve local control and survival: a meta-analysis. Radiother Oncol 2014;110:3–8. 10. Sakib N, Li N, Zhu X, Li D, Li Y, Wang H. Effect of postoperative radiotherapy on outcome in resectable stage IIIA-N2 non-small-cell lung cancer: an updated meta-analysis. Nucl Med Commun 2018;39:51–9. 12. Mehta V. Radiation pneumonitis and pulmonary fibrosis in non-small-cell lung cancer: pulmonary function, prediction, and prevention. Int J Radiat Oncol Biol Phys 2005;63:5–24. 13. Wisnivesky JP, Halm EA, Bonomi M, Smith C, Mhango G, Bagiella E. Postoperative radiotherapy for elderly patients with stage III lung cancer. Cancer 2012;118:4478–85. 14. Matsuguma H, Nakahara R, Ishikawa Y, et al. Postoperative radiotherapy for patients with completely resected pathological stage IIIA-N2 non-small cell lung cancer: focusing on an effect of the number of mediastinal lymph node stations involved. Interact Cardiovasc Thorac Surg 2008;7:573–7.
|
|