


Introduction
Glioblastoma (GBM) is the most common malignant primary brain tumor in adults. Maximal safe surgical resection followed by postoperative radiotherapy with concurrent and adjuvant temozolomide (TMZ) is the standard treatment [1]. Although imaging techniques and treatment modalities have improved, prognosis of GBM remains to be poor with overall survival of 1–2 years [2]. Local recurrence is the most frequent cause of treatment failure in patients with high grade glioma [3]. Most patients develop intracranial recurrence within or in close proximity to the high-dose radiation field [4]. Large prospective randomized and retrospective institutional dose-escalation studies have failed to demonstrate a survival advantage for GBM patients [5]. This failure was attributed to one or more of the following barriers, inadequate imaging resulting in geographic misses, innate tumor radioresistance, and accelerated tumor repopulation [6].
Planning target volume (PTV) margins and treatment regimens vary significantly among institutions [7]. The Radiation Therapy Oncology Group (RTOG) recommends a two-phase treatment to a total dose of 60 Gy in 30 fractions, where the initial clinical target volume (CTV) typically includes postoperative cavity and contrast enhancing residual tumor with peritumoral edema plus a 2-cm margin, followed by a boost field defined as postoperative cavity T1 contrast-enhancing residual tumor plus a 2-cm margin as per RTOG 0525 and RTOG 0825 trials [8,9]. The European Organization for Research and Treatment of Cancer (EORTC) prefers a single-phase treatment with a 2–3 cm margin around the gross tumor volume without taking into account the peritumoral edema [10]. Although these international group trials recommended 2–2.5 cm CTV margins in order to account for microscopic disease, most recent MRI-based studies utilized margins smaller than 2 cm and they reported similar recurrence patterns [11]. The Adult Brain Tumor Consortium (ABTC) margins are smaller (as low as 0.5 cm) than those utilized in RTOG and EORTC protocols.
Advanced radiotherapy techniques like intensity-modulated radiotherapy (IMRT) and volumetric modulated arc therapy (VMAT) improve the therapeutic ratio by generating steep dose gradients outside the target volume and decreasing the dose to adjacent critical structures [12]. Therefore, especially when using limited margins, precise and accurate delineation of target volumes is of utmost importance. Studies have shown that surgical cavity volume changes continue to occur during the course of radiotherapy in GBM patients who underwent gross total tumor resection [13,14]. These anatomical changes in surgical cavity and contrast-enhancing residual volume may influence the planned dose distribution.
Therefore, appropriate imaging and adaptive treatment planning for limited-field radiotherapy (RT) might have clinical significance for the avoidance of geographic misses and reduced toxicity. There are no studies evaluating whether these smaller margins can be compensated by using the adaptive boost approach for limited margin RT by obtaining an interim MR obtained before boost treatment planning.
This study analyzed whether adaptive treatment boost planning based on MR scans taken before the 2nd phase of RT had any effect on dose distribution, organs-at-risk (OARs) doses, and recurrence patterns. Our purpose is to evaluate whether possible marginal misses secondary to limited-field RT could be avoided by adaptive boost planning and if there were any groups of patients that treating with smaller margins was not feasible.
Materials and Methods
1. Patient characteristics
Twenty-four patients with pathologically confirmed GBM, treated in our clinic between June 2018 and May 2020 were included in this study. Patients underwent tumor resection or biopsy followed by radiotherapy with concurrent temozolomide and adjuvant temozolomide was started 4 weeks after RT.
Fourteen of 24 patients had undergone gross total resection, while six patients had a subtotal resection (STR) and four had a stereotactic biopsy. Lesions were located in the right parietal in three patients, right frontal in two, left frontal in two, right temporal in four, left temporal in four, left frontotemporal in one, left parietal occipital in one, left frontoparietal in two patients, and five patients presented with multifocal disease.
2. Target volume delineation
All patients were immobilized with thermoplastic head masks. Treatment was planned and applied in two phases. Preoperative and postoperative MR scans were used to define target volumes. Preoperative MR was used to define the initial shape, size and location of the tumor. Postoperative RT planning MR and CT were used to determine the postoperative target volume and they were performed twice for adaptive treatment planning. Initial scans (CT_initial, MR_initial) were taken a few days before the initial phase of the treatment and the second scans (CT_adapt, MR_adapt) were taken a few days before the boost phase.
Radiotherapy simulation CT images in 2–3 mm increments were obtained for treatment planning and same day MR T1 pre- and post-gadolinium and T2 fluid-attenuated inversion recovery (FLAIR) sequences were anatomically registered with planning CT scan using Eclipse treatment planning system (version 13.6; Varian Medical Systems, Palo Alto, CA, USA).
According to our clinical protocol, during the first phase of target delineation, GTV1 was determined as surgical cavity including suspicious involvement and edema which was determined via T2-weighted MR_initial sequences, and it was expanded by 0.5–1 cm to create CTV1 and by 1–2 mm to determine PTV1. For statistical comparison GTV2 volume was determined on the MR_initial T1 contrast images to include the contrast-enhancing area and surgical cavity and was extended by 0.5–1 cm margin to create CTV2 and 1–2 mm margin to generate PTV2.
CT_adapt and MR_adapt images were obtained for adaptive planning for the second phase of the treatment around 21 ± 1st fraction. MR_adapt T1 contrast images were used to define GTV2_adapt. CTV2_adapt was created on CT_adapt by adding a margin of 0.5–1 cm to the GTV2-_adapt and PTV2_adapt was generated by adding a margin of 1–2 mm to CTV2_adapt. CTV was modified to respect the anatomical boundaries.
3. Treatment planning
Treatment plans were created by using the volumetric arc technique with 6-MV photon energy and 4–5 arcs including non-coplanar partial arcs. The beams were arranged according to the size and location of the target volume. Treatment plan for the first phase was created on CT_initial and a dose of 46 Gy in 23 fractions was prescribed to the PTV1 while the treatment plan for the second phase was generated on CT_adapt and 14 Gy in 7 fractions was prescribed to PTV2_adapt to a total dose of 60 Gy. Treatment plans were accepted when the 95% isodose line covered 95% of the PTV. The normal tissues contoured included the brainstem, optic chiasm, left and right optic nerves, left and right eyes, and whole brain was defined as brain tissue minus PTV. OAR dose constraints were maximum 54 Gy for optic nerves and optic chiasm and 60 Gy for brainstem. Macula dose was limited to maximum 45 Gy and lens dose was limited to 10 Gy. For this study, a boost plan was generated for PTV2 on the CT_initial set. This plan (Plan_initial) was recalculated on CT_adapt by keeping the same optimization and normalization values. A treatment plan for the second phase (Plan_adapt) was created on CT_adapt for PTV2_adapt volume. Dose volume histogram (DVH) parameters for target volumes and OARs were compared using these two plans generated on CT_adapt. All optimizations and dose calculations were performed using Eclipse treatment planning system.
4. Plan evaluation and statistical analysis
Target volume changes between CT_initial and CT_adapt were evaluated by calculating average ± standard deviation volume differences for GTV2, GTV2_adapt, CTV2, CTV2_adapt and PTV2, PTV2_adapt. Differences between Plan_initial and Plan_adapt were assessed by using DVHs through comparison of mean and median doses (Dmean, Dmedian) for PTV2_adapt, V95 (volume receiving 95% of the prescribed dose), and D95 (dose received by 95% of the PTV2_adapt). Maximum and mean doses for brainstem, optic chiasm, optic nerves, eyes, and healthy brain tissue volume receiving 10 Gy (V10) were examined and compared for both plans. V10 for healthy brain tissue was calculated by subtracting PTV from total brain volume. Paired sample t-test was used to compare PTV D95 doses, all other variables were compared using a Wilcoxon signed-rank test.
5. Follow-up and patterns of failure
Patients were followed up with MR scans 4 weeks after the completion of RT and every 3 months thereafter. The Response Assessment in Neuro-Oncology (RANO) criteria was used for evaluation. Disease progression was determined by the treating physician. MR scans indicative of tumor progression were registered with Plan_adapt to define whether there were any marginal misses as a result of limited margins or target volume modification when tumor shrinkage was observed. The pattern of failure was determined according to the location of the recurrent tumor in relation to the 95% isodose line. They were classified as “in-field” if the recurrent T1-enhancing tumor volume was covered by the 95% isodose line and out-field if theory were outside the 20% isodose line. In cases of multiple discrete sites of failure, each lesion was independently analyzed relative to the 95% isodose line. In cases of multiple recurrence sites each lesion was evaluated independently.
Results
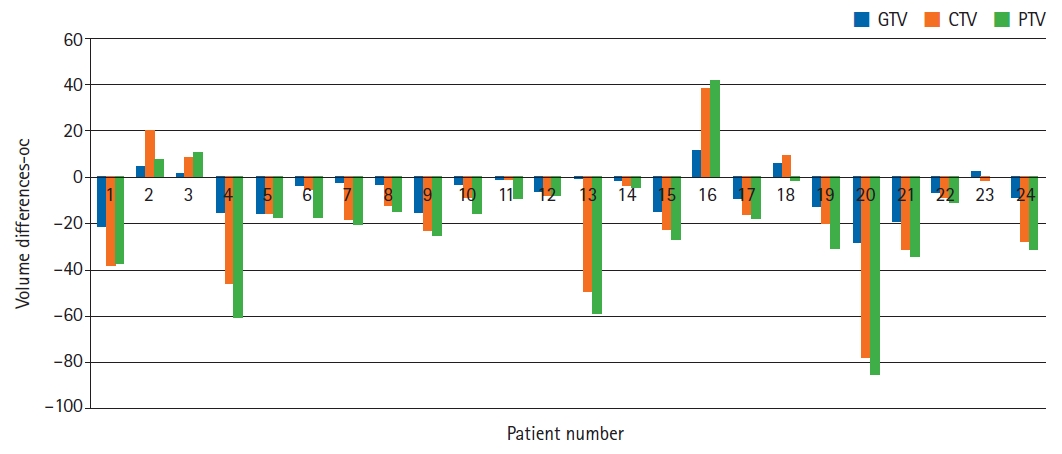
Initial radiotherapy simulation CT and MR scans were performed at a median of 15 days (range, 9 to 33 days) after surgery and median 4 days after biopsy (range, 3 to 28 days). Time interval days between MR_initial and MR_adaptive were found average (min–max) 30.5 (28–38), median 29 days. A second MR scan for an adaptive plan was taken on the 21 ± 1st fraction of the treatment. Target volume expansion was noted in five patients (21%) and three of these patients had a stereotactic biopsy, one had STR and one had GTR. Target volume shrinkage was observed in 19 patients (79%), one patient had biopsy, four patients underwent STR, and 14 had GTR. In patients with shrinkage, mean GTV decrease was 26.39% (8.46 mL) and in the group with expansion, mean GTV increase was 13.95% (5.3 mL). For all patients, mean GTV was 45.0 mL on initial MR and 38.2 mL on adaptive MR. Expansion and shrinkage of GTV resulted in CTV and PTV changes. Mean CTV were 122.3 mL and 107.3 mL on initial and adaptive CT scans, respectively. For patients with shrinkage, mean CTV decrease was 17.7% (average, 21.8 mL) while for the ones with volume expansion mean change in CTV increase was 22.4 % (average, 19.1 mL). Mean PTV were 153.1 mL and 133.6 mL on initial and adaptive CT scans, respectively. Mean change in PTV showed 17% decrease (average, 22.8 mL) and an 18.3% decrease (average, 20.1 mL).
Mean changes between the initial and adaptive GTV, CTV, and PTV were statistically significant, with p-values of 0.003, 0.004, and 0.001, respectively. The differences of GTV, CTV, and PTV on initial and adaptive scans are shown in Table 1 and Fig. 1.
We generated sum plans with boost Plan_initial and Plan_adapt. While PTV Dmean (p = 0.429), PTV D95 (p = 0.081), PTV Dmedian (p = 0.975) changes were not statistically significantly, PTV V95 (p = 0.01) differences were found to be statistically significant. Maximum dose differences for brainstem and optic chiasm were significant (p = 0.018, p = 0.019), while mean doses were not significant (p = 0.966, p = 0.415), respectively. Maximum ipsilateral optic nerve doses decreased significantly in the Plan_adapt when compared to Plan_initial on sum plans (p = 0.014). Ipsilateral optic nerve mean (p = 0.11), maximum and mean doses for ipsilateral eye (p = 0.140, p = 0.59), contralateral eye (p = 0.721, p = 0.366) and maximum, mean doses for contralateral optic nerve (p = 0.594, p = 0.867) did not show significant difference between adaptive and non-adaptive plans sum. V10 for healthy brain tissue was not found to significantly change in the adaptive plan (p = 0.193). When sum plans were compared, p-values for brainstem, chiasm, contralateral and ipsilateral eye, and optic nerve maximum and mean doses were found to be similar.
Although the p-value for V10 dose was significant for boost adaptive plan, there was no difference when plan sums were compared. Difference for PTV V95 was borderline significant for the adaptive boost plan. However, the difference was found to be significant when plan sums were compared.
The p-values for differences in PTV Dmean, Dmedian, V95, D95, and OAR maximum and mean doses for boost and plan sum are demonstrated in Tables 2 and 3.
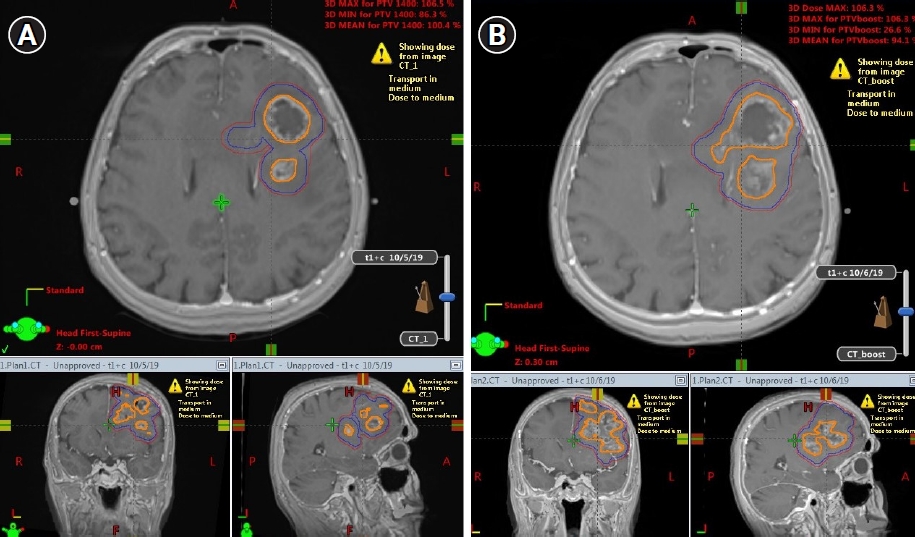
Fig. 2A and 2B present GTV, CTV, and PTV expansion on MR_initial and MR_adaptive images, respectively. Fig. 3A shows Plan_initial dose distribution, Fig. 3B displays Plan_adapt dose distribution, and Fig. 3C presents undercoverage of PTV V95 if the boost treatment was applied with Plan_initial instead of Plan_adapt.
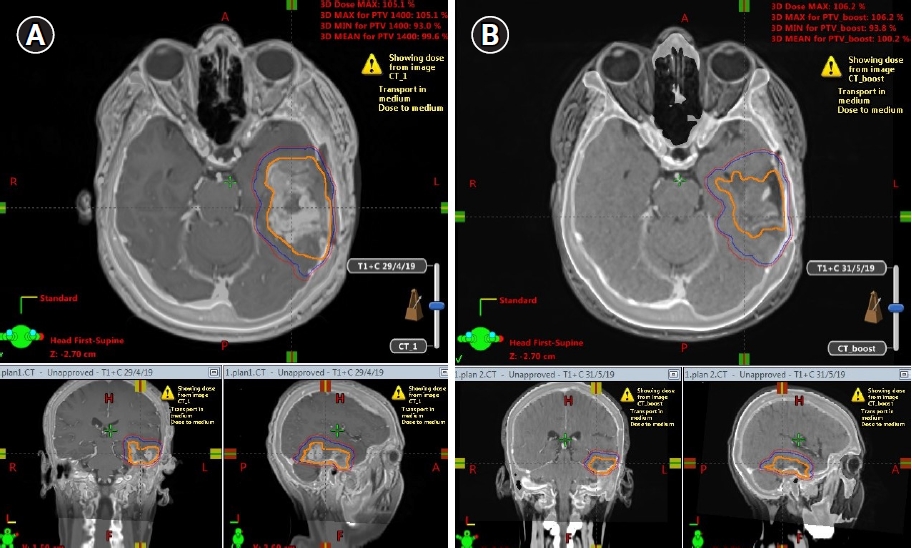
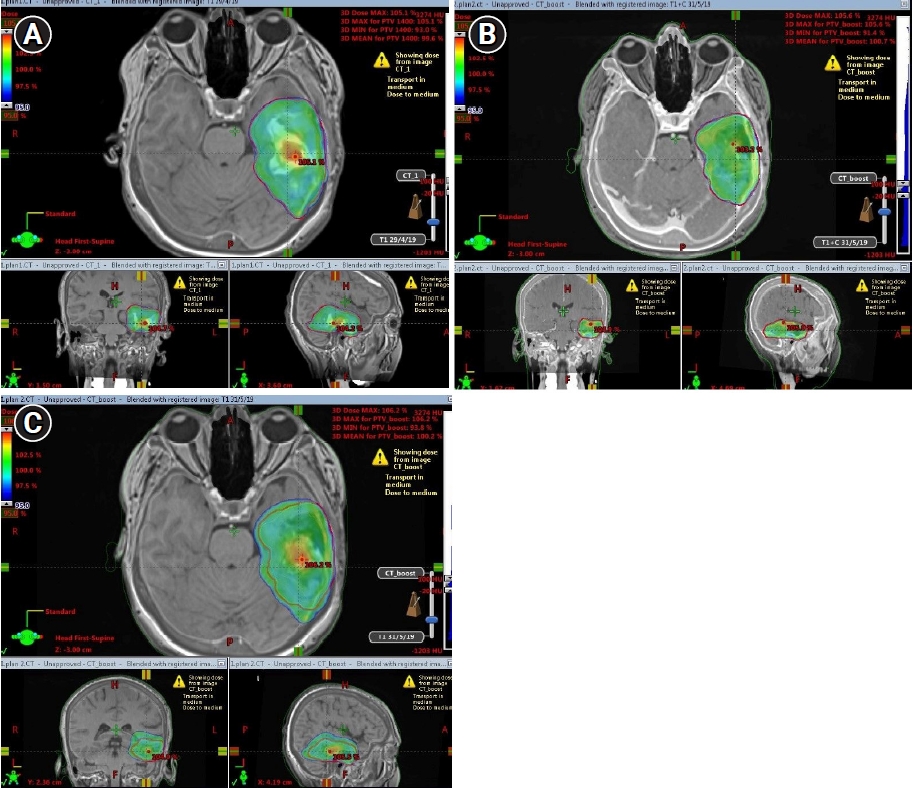
Fig. 4A and 4B present GTV, CTV, and PTV shrinkage on MR_initial and MR_adaptive images, respectively. Fig. 5A shows Plan_initial dose distribution, Fig. 5B displays Plan_adapt dose distribution, and Fig. 5C presents overcoverage of PTV V95 if the boost treatment was applied with Plan_initial instead of Plan_adapt.
Gross total resection was found to be statistically correlated with tumor shrinkage (p < 0.05). STR correlation with tumor volume changes was not significant (p = 0.089). The effect of biopsy on tumor expansion/shrinkage could not be analyzed because of limited patient number.
At a median follow-up time of 14 months (range, 10 to 20 months), the progression-free survival was median 8 months (range, 1 to 20 months). Fifteen patients had in-field recurrences, two patients had multifocal recurrences within and outside the target volume. Six of them were treated with fractionated reirradiation with concurrent bevacizumab, while two had radiosurgery. Median progression-free survival for five patients with tumor expansion was 3 months (range, 3 to 10 months).
Discussion and Conclusion
This study showed that the adaptive re-contouring of the boost volume using T1 contrast sequences of an MR taken right before the second phase of RT for GBM contributes to the target volume coverage, as well as protection of normal tissue and adaptive boost planning approach can be recommended when using limited CTV margins.
This study revealed that five of 24 patients were found to have target volume expansion in which case the target volumes were not fully covered by treatment dose and geographic misses were inevitable, if adaptive imaging and planning were not performed. The remaining 19 patients demonstrated shrinkage of target volumes, therefore the normal tissue volumes within the treatment dose coverage were reduced by adaptive planning. The statistically significant target volume changes determined by initial and adaptive MR scans reveal the necessity of obtaining an adaptive MR to boost target volume delineation.
Precise delivery of the planned treatment dose to the target volume depends on the accuracy of target delineation. Therefore, with respect to our study results, a boost treatment plan optimized to the adaptive boost volume will ensure adequate dose coverage.
Although it might not be possible to acquire adaptive MR imaging for each GBM patient, our study revealed that the patients who underwent biopsy would benefit most from this approach, since there was a trend (3 out of 4) for target volume expansion for this patient group. Therefore, with respect to our study results an adaptive boost treatment planning can be recommended for patients with biopsy when a limited-field RT approach is used otherwise these patients might not be good candidates for limited margins.
Additionally, the patients who underwent GTR were inclined to have decreased target volumes, most probably related to the shrinkage of surgical cavities. Therefore, an adaptive MR and a boost delineation based on this scan will ensure lower OAR doses especially when these cavities are located in close proximity to structures like optic chiasm, optic nerve, and brainstem. Our study showed that this adaptive treatment planning strategy may especially be beneficial for reducing the maximum doses to these vulnerable structures. Also, the significant decrease observed in the normal brain tissue receiving 10 Gy might provide better preservation of brain functions when patients are treated with an adaptive plan [15-18].
Kim et al. [13] included only GBM patients with GTR in their study and suggested that surgical cavity volume reduction following surgery and during RT would necessitate volume-adapted replanning to decrease the normal brain tissue volume exposed to high radiation doses. They also emphasized the potential spatial changes of the cavity. Our results also suggest that the patients with GTR are more prone to shrinkage of surgical cavity volumes, therefore the adaptive planning for boost approach aims to reduce the irradiated normal tissue volume while undercoverage might be a concern for patients with biopsy only or STR. Adaptive treatment planning compensated for these spatial and volumetric changes in our study when compared to non-adaptive planning.
Several previous studies have shown that cavity volume and edema size change with the time elapsed after surgical resection. Champ et al. [19] showed that 23 of 24 CTV1 decreased in size within an average of 17 days between postoperative MR and treatment planning MR. This decrease in size can potentially spare proximal OARs and normal brain tissue from receiving the initial dose of 46 Gy. In contrast, CTV2 increased in 16 of 24 patients, which could lead to undercoverage of target volume if treated based on postoperative MR scan. Therefore, Champ et al. [19] recommended obtaining planning MR scans closer to the time of CT simulation, as well as starting the treatment as soon as possible to reduce the potential further volume changes that might negatively impact the dose coverage.
Iuchi et al. [20] presented similar findings, revealing large variations in surgical cavities with both expansion and shrinkage occurring mostly within the first 2 weeks after craniotomy for HGG patients. Although this study showed a benefit with regards to normal brain tissue reduction within the RT field, it failed to demonstrate a possible local control benefit. Actually, they concluded that it was unlikely to have a clinical benefit of decreased recurrence since no failures were seen outside the target volumes defined on immediate MRs. However, this study did not investigate the efficacy of boost MR scans for decreasing local recurrence.
Tsien et al. [21] study included 21 patients with high-grade glioma treated with three-dimensional conformal radiotherapy (3D-CRT) with a median dose of 70 Gy. The median time interval between surgical resection and pre-RT MR was 3.1 weeks (range, 2.1 to 3.8 weeks) and two additional scans were performed during radiotherapy (Weeks 1 and 3). More than half of the patients (57%) underwent stereotactic biopsy only, while the remaining underwent STR. They found that two cases had an objective decrease in GTV, 12 cases revealed a slight decrease in the rim enhancement or changes in the cystic appearance of the GTV, two cases showed no change in GTV, while three cases demonstrated an increase in tumor volume. Their study demonstrated that changes in tumor volume of high-grade gliomas can occur as early as Weeks 1 to 3, and the use of smaller margins in IMRT without routine imaging may lead to underdosage of the target volume, although the clinical significance of these risks was not further studied.
A study of Shukla et al. [22] showed that 12 out of 15 patients with unifocal disease had tumor volume decrease on T2 weighted MR at Week 5 of RT while the remaining had demonstrated target volume increase. They recommended re-planning MR, to define boost fields. Our study compared the contrast-enhancing and/or postoperative cavity volumes on initial planning and 4th week (before 2nd phase of RT) T1 contrast MR sequences. T2 volume changes were not analyzed in our study since we aimed to observe boost volume changes. Yang et al. [23] revealed that adaptive treatment planning during RT led to decreased OAR D2% and D50% values and healthy brain tissue given the GTV size that decreased throughout the therapy. Our study was in accordance with the findings of Yang et al. [23], with regards to adaptive planning providing better protection of normal brain tissue.
Mehta et al. [24] reported three patients treated with MR-guided RT, followed up by daily MR scans. All patients had a trend of daily cavity volume reduction. One patient with baseline increased edema initially had a trend for daily edema volume increase followed by a daily decrease. Their results suggest that daily MR could be used for onboard resimulation and adaptive RT to compensate for size fluctuation of tumor volumes, cavities, or cystic components, as well as limit the dose to healthy brain tissue.
Although our clinical protocol recommends personalized limited RT margins for each patient depending on the extent of the tumor, we did not observe any marginal misses. There is some concern whether reducing the target volume to the shrinking MR visible tumor might impair tumor control, since the dissolving tumor might leave behind microscopic disease. Therefore, one might argue that adaptive reduction of the target volume when cavity shrinkage occurs might cause undercoverage of the microscopic disease, especially considering our smaller CTV margins. However, this was not our experience given the recurrences were in-field, probably because these areas received the microscopic dose.
Previous research emphasized the importance of target volume delineation and that it can translate into improved tumor control and/or reduced radiation toxicity; therefore, any effort should be made to identify the optimal imaging approach and appropriate safety margins. Functional imaging techniques like MRS, SPECT, and PET may allow more accurate delineation of the tumor volume by providing information about edema versus diffuse tumor infiltration [25-28].
MR imaging is the gold standard for RT planning and treatment response assessment of GBM patients. However, more detailed functional imaging is needed during RT to identify whether the radiological tumor expansion is related to tumor progression or tumor necrosis. ACRIN 6686, a companion study to RTOG 0825 aimed to evaluate the volumetric and radiological changes with serial MR scans during the chemoradiotherapy and adjuvant chemotherapy phases and their relation to overall survival [29]. They reported the differences between postoperative MR scans and the ones taken before the 4th cycle of temozolomide and suggested increasing T1 contrast-enhancing and FLAIR area size was significantly associated with worse survival.
According to our results gross total resection was significantly associated with cavity shrinkage. Although the effect of biopsy on tumor expansion/shrinkage could not be analyzed because of limited patient number, three out of five patients had tumor expansion.
Although this study’s main aim was not to investigate the relationship between radiological changes occurring during RT and treatment outcomes, based on our observations limited to five patients with tumor volume expansion during treatment, we can suggest that there seems to be an earlier time point than initial follow-up MR scan at 4 weeks after RT where radiological changes can be used to predict response to treatment.
Rapidly developing MR Linac systems might be the missing link to better observe the volume and possible dosimetric changes occurring during RT for GBM. Since most studies show a dynamic process during treatments, using these images in the light of radiomics can provide us with valuable biological data of these tumors and also allow us to adjust the treatments in real-time while using smaller margins to improve the therapeutic ratio. Whether these daily targeting and planning optimization approaches provided by MR Linac systems reflect on clinical outcomes is a subject for future studies. Ongoing, UNITED phase 2 trial is investigating the effects of reduced CTV margin for GBM with contrast enhanced adaptive MR Linac based RT [30].
In conclusion, the results of this study confirm the occurrence of target volume changes during treatment for GBM patients receiving radiotherapy. An adaptive plan based on a recent MR scan for the boost phase of the RT can provide better normal tissue sparing for patients with target shrinkage. Special consideration is required when limited margins are used in order to avoid undercoverage of treatment volumes in case of target volume expansion. The avoidance of this undercoverage might lead to better tumor control, while treatment volume decrease might avoid neurotoxicity.