Dynamic contrast-enhanced magnetic resonance imaging parameter changes as an early biomarker of tumor responses following radiation therapy in patients with spinal metastases: a systematic review
Article information

Abstract
Purpose
This systematic review aims to assess and summarize the clinical values of dynamic contrast-enhanced magnetic resonance imaging (DCE-MRI) parameter changes as early biomarkers of tumor responses following radiation therapy (RT) in patients with spinal metastases.
Materials and Methods
A systematic search was conducted on five electronic databases: PubMed, Scopus, Science Direct, Cochrane, and Embase. Studies were included if they mentioned DCE-MRI parameter changes before and after RT in patients with spinal metastases with a correlation to tumor responses based on clinical and imaging criteria. The Quality Assessment of Diagnostic Accuracy Studies 2 was used to assess study quality.
Results
This systematic review included seven studies involving 107 patients. All seven studies evaluated the transfer constant (Ktrans), six studies evaluated the plasma volume fraction (Vp), three studies evaluated the extravascular extracellular space volume fraction, and two studies evaluated the rate constant. There were variations in the type of primary cancer, RT techniques used, post-treatment scan time, and median follow-up time. Despite the variations, however, the collected evidence generally suggested that significant differences could be detected in DCE-MRI parameters between before and after RT, which might reflect treatment success or failures in long-term follow-up. Responders showed higher reduction and lower values of Ktrans and Vp after RT. DCE-MRI parameters showed changes and detectable recurrences significantly earlier (up to 6 months) than conventional MRI with favorable diagnostic values.
Conclusion
The results of this systematic review suggested that DCE-MRI parameter changes in patients with spinal metastases could be a promising tool for treatment-response assessment following RT. Lower values and higher reduction of Ktrans and Vp after treatment demonstrated good prediction of local control. Compared to conventional MRI, DCE-MRI showed more rapid changes and earlier prediction of treatment failure.
Introduction
With the advancement of cancer treatment regimens, there has been a rise in the survival rates of cancer patients, which has led to a prolonged overall survival and increased incidence of spinal metastasis [1]. As the disease progresses, 40%–70% of advanced cancer patients will develop spinal metastases [2], which has become the third most frequent site for metastases following the lungs and liver [3]. Spinal metastases are the leading causes of morbidity in patients with cancer. In addition to being a common cause of cancer pain, spinal metastases frequently result in pathological compression fractures of the vertebrae and metastatic epidural spinal cord compression. Symptoms include pain, paralysis, sensory disturbances, sexual dysfunction, urinary and anal incontinence, decreased quality of life, and death [2,4].
Radiation therapy (RT) is one of the modalities of choice for spinal metastases. RT is applied to relieve pain, control paralysis, and alleviate related symptoms [5]. Initially, conventional external beam radiotherapy (EBRT) was the main type of RT for spinal metastases, but despite its demonstrated efficacy, many patients continue to experience tumor progression following RT [6]. Due to the wide radiation field of EBRT, the radiation dose delivered to the tumor must be kept to a minimum. This limitation of EBRT has led to the development of more advanced RT techniques, such as CyberKnife radiosurgery and stereotactic body radiation therapy (SBRT), which can deliver optimal therapeutic radiation doses while reducing radiation exposure to adjacent structures [7].
Conventional magnetic resonance imaging (MRI) is the gold-standard modality for assessing tumor response in spinal metastases. Local control is described as the absence of progression, which is shown by serial imaging studies as an increase in tumor size in the treated area in 2–3 consecutive MRI scans performed 6–8 weeks apart [8]. While conventional MRI remains the gold standard for therapy evaluation, it provides limited information about the pathogenesis and viability of lesions [6]. The size of a lesion is frequently difficult to assess. Reports claim that in conventional MRI images, nearly half (49.4%) of metastatic spinal tumors exhibit no changes after stereotactic radiosurgery (SRS) [9].
RT can result necrosis and fibrosis in the tumor and surrounding healthy tissues, resulting in tissue alterations following RT. Thus, it is frequently challenging to assess the response of spinal tumors using the Response Evaluation Criteria in Solid Tumors (RECIST) v1.1, making it difficult to tell whether the disease has progressed [10,11]. Evaluation of the tumor response following radiation has significant consequences for patient care, and early diagnosis of tumor response is mandatory to aid clinicians in determining salvage therapy more promptly and improve clinical outcomes [12].
In recent years, dynamic contrast-enhanced MRI (DCE-MRI) has become more common for assessing spinal metastases [6]. DCE-MRI is superior to conventional MRI for evaluating tumor structures and permeability [13]. Using dynamic T1-weighted gradient-recalled echo sequences, this method measures changes in gadolinium concentrations over time in tissues [6], using a kinetic analysis model with some parameters, namely, the transfer constant (Ktrans), plasma volume fraction (Vp), and extravascular extracellular space volume fraction (Ve) [13], which respectively represent the blood volume, blood flow, vascular permeability, mean transit time, distribution of contrast agent volume, and interstitial space [12]. Malignant tumors undergo neovascularization or angiogenesis, recruitment, synthesis, and vascular tissue formation, which signify tumor development, proliferation, and metastasis [14,15]. DCE-MRI parameters are closely linked to tumor biology and can serve as markers of anti-angiogenic and cytotoxic responses. Furthermore, they are more sensitive than volumetric assessments in the detection of subtle internal tumor responses [16].
DCE-MRI has been reported to be a good predictor of tumor response and post-RT clinical outcomes in various malignancies, including head and neck, cervical, brain, breast, prostate, as well as colon cancers [17-21]. Several studies have reported differences in DCE-MRI parameter changes between responders (treatment success) and non-responders (treatment failure) among patients with spinal metastases undergoing radiation. Changes after RT can be detected significantly earlier with DCE-MRI than with conventional MRI. However, most studies have reported a limited sample size [22-28]. The aim of this systematic review was to examine the available data about the significance of post-radiation DCE-MRI parameter changes as early biomarkers of tumor response following RT in patients with spinal metastases.
Materials and Methods
1. Search strategy
This study followed the Preferred Reporting Items for Systematic Review and Meta-Analysis guidelines. From December 2022 to January 2023, a comprehensive literature search was conducted using five electronic databases: PubMed, Scopus, Science Direct, Cochrane, and Embase. The goal was to identify all studies relevant to the role of changes in DCE-MRI parameters after RT and their correlation to tumor response evaluation in spinal metastases patients. The search terms included ("dynamic contrast-enhanced magnetic resonance imaging" OR "DCE-MRI") AND ("spinal metastases" OR "spine metastases" OR “bone metastases” OR “bone metastasis” OR “osseous metastases” OR “osseous metastasis”). Considering the scarce availability of study results, we broadened our search terms with “bone metastasis OR bone metastases” and “osseous metastasis” OR “osseous metastases.” Since spinal metastasis responses are essentially analogous to other bone metastasis, the inclusion of broader search terms regarding RT for other bone metastasis would yield helpful information in addition to the small number of available studies. The analysis of the selected articles and the writing of the systematic review were conducted from February 2023 to June 2023.
2. Eligibility criteria
The included studies fulfilled the following criteria. (1) The population comprised patients with spinal or bone metastases who underwent conventional, stereotactic, CyberKnife, and image-guided radiation therapy (IGRT). (2) The index test involved clinical or imaging follow-up or a combination of both. (3) The reference test involved DCE-MRI parameters assessed before and immediately after RT (6 months). (4) The outcome included the tumor response after RT. The study designs were observational studies (both retrospective and prospective). The search method excluded conference abstracts, letters, editorials, guidelines and consensus, systematic reviews or meta-analyses, case reports, literature reviews, xenograft/animal model studies, trial registries, and unpublished studies. The search strategy imposed no language restrictions.
3. Study selection
Four independent reviewers performed the literature search and study selection. The selection method consisted of scanning titles and abstracts, filtering similar or duplicate articles using the EndNote 20 tool, and reviewing full-text articles. Furthermore, references from selected research were evaluated to identify other eligible studies. Disagreements were settled by discussion among all authors.
4. Data extraction and study-quality assessment
The data obtained included the following. (1) The study characteristics included author information, study year, study duration, the country where the study was conducted, study design, number of patients, and number of lesions. (2) The patient characteristics included age, underlying malignancy, RT used, radiation dose provided, RT site, and median follow-up time. (3) The data from MRI examinations included Tesla MRI power, MRI parameters utilized, processing software, DCE-MRI parameters used, and time of DCE-MRI evaluation before and after RT. (4) Regarding tumor response data, responders were defined as patients with complete or partial responses, whereas non-responders were defined as those with stable disease or progressive disease based on RECIST v1.1 or other clinical/imaging considerations. (5) Other data included the diagnostic properties of DCE-MRI in the evaluation of tumor response.
5. Risk of bias and applicability
The quality and risk of bias of the included studies in this systematic review was evaluated following the Quality Assessment of Diagnostic Accuracy Studies 2 (QUADAS-2). Each domain was graded as low risk, unclear/moderate concerns, or high risk. RevMan software (https://revman.cochrane.org) was used to create bias risk graphs. Due to the included studies' diverse results, we could not perform a meta-analysis.
Results
1. Study selection
Seven studies were ultimately included in this systematic review. A total of 359 studies were identified from five databases. After excluding duplicates from the search, 274 studies were further evaluated. After examining the titles and abstracts of the available studies, 256 studies were excluded. In total, the full-text of 18 studies was reviewed. Studies that did not assess changes in DCE-MRI parameters following RT in individuals with spinal or bone metastases were excluded. Ultimately, seven studies met the eligibility requirements. Fig. 1 demonstrates the flow of the making of this systematic review.
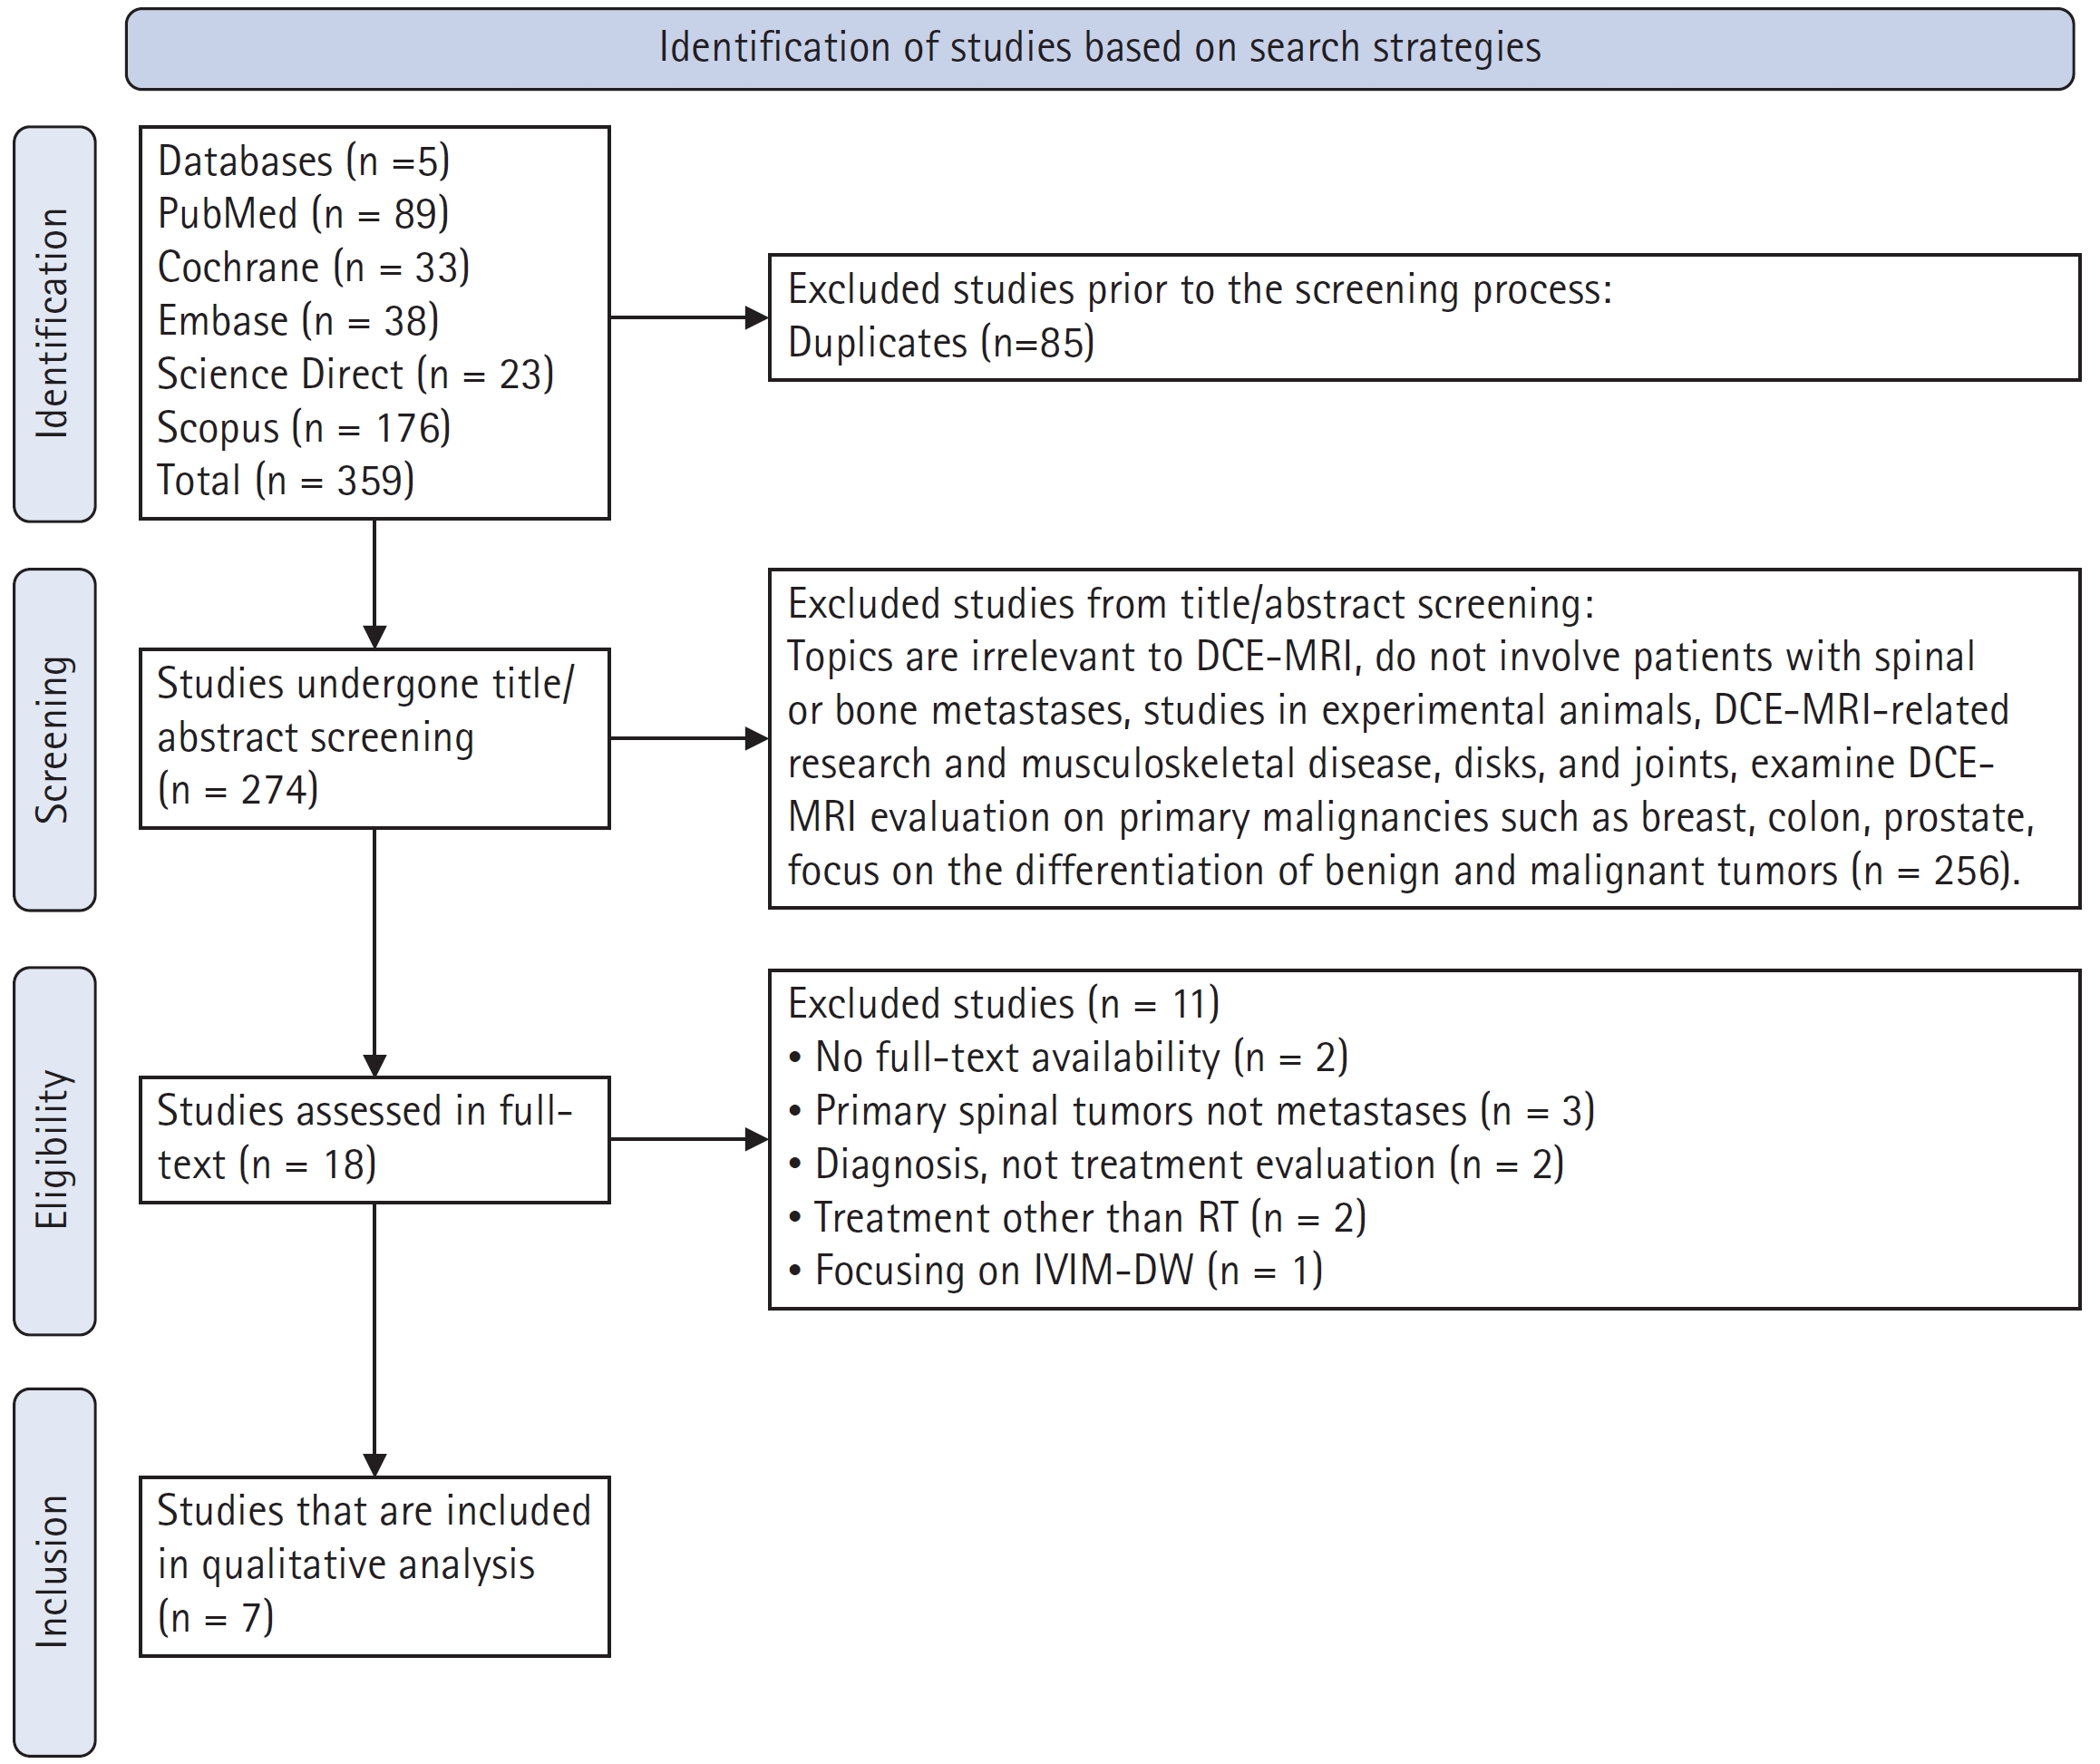
Preferred Reporting Items for Systematic Reviews and Meta-Analyses (PRISMA) flow chart. DCE-MRI, dynamic contrast-enhanced magnetic resonance imaging; RT, radiation therapy; IVIM, intravoxel incoherent motion; DW, diffusion-weighted.
2. Quality assessment of the included studies
The quality of the studies was evaluated following the QUADAS-2 checklist. Fig. 2 shows the risk of bias and applicability of the selected studies. Overall, the risk of bias was deemed to be low. Two studies were considered to have a moderate/uncertain risk of bias in the patient-selection domain because they did not specify the methodology of patient selection and whether it was consecutive or not [22,24]. Another study was deemed to have a significant probability of patient-selection bias due to the explicit admission that they did not select participants in a randomized and sequential fashion [23]. In all studies, the reasons for patient exclusion were explicit and appropriate [20,22-24,26-28]. In general, however, the selected individuals were heterogeneous in regard to the primary malignancy and the type of RT techniques applied [22-27].
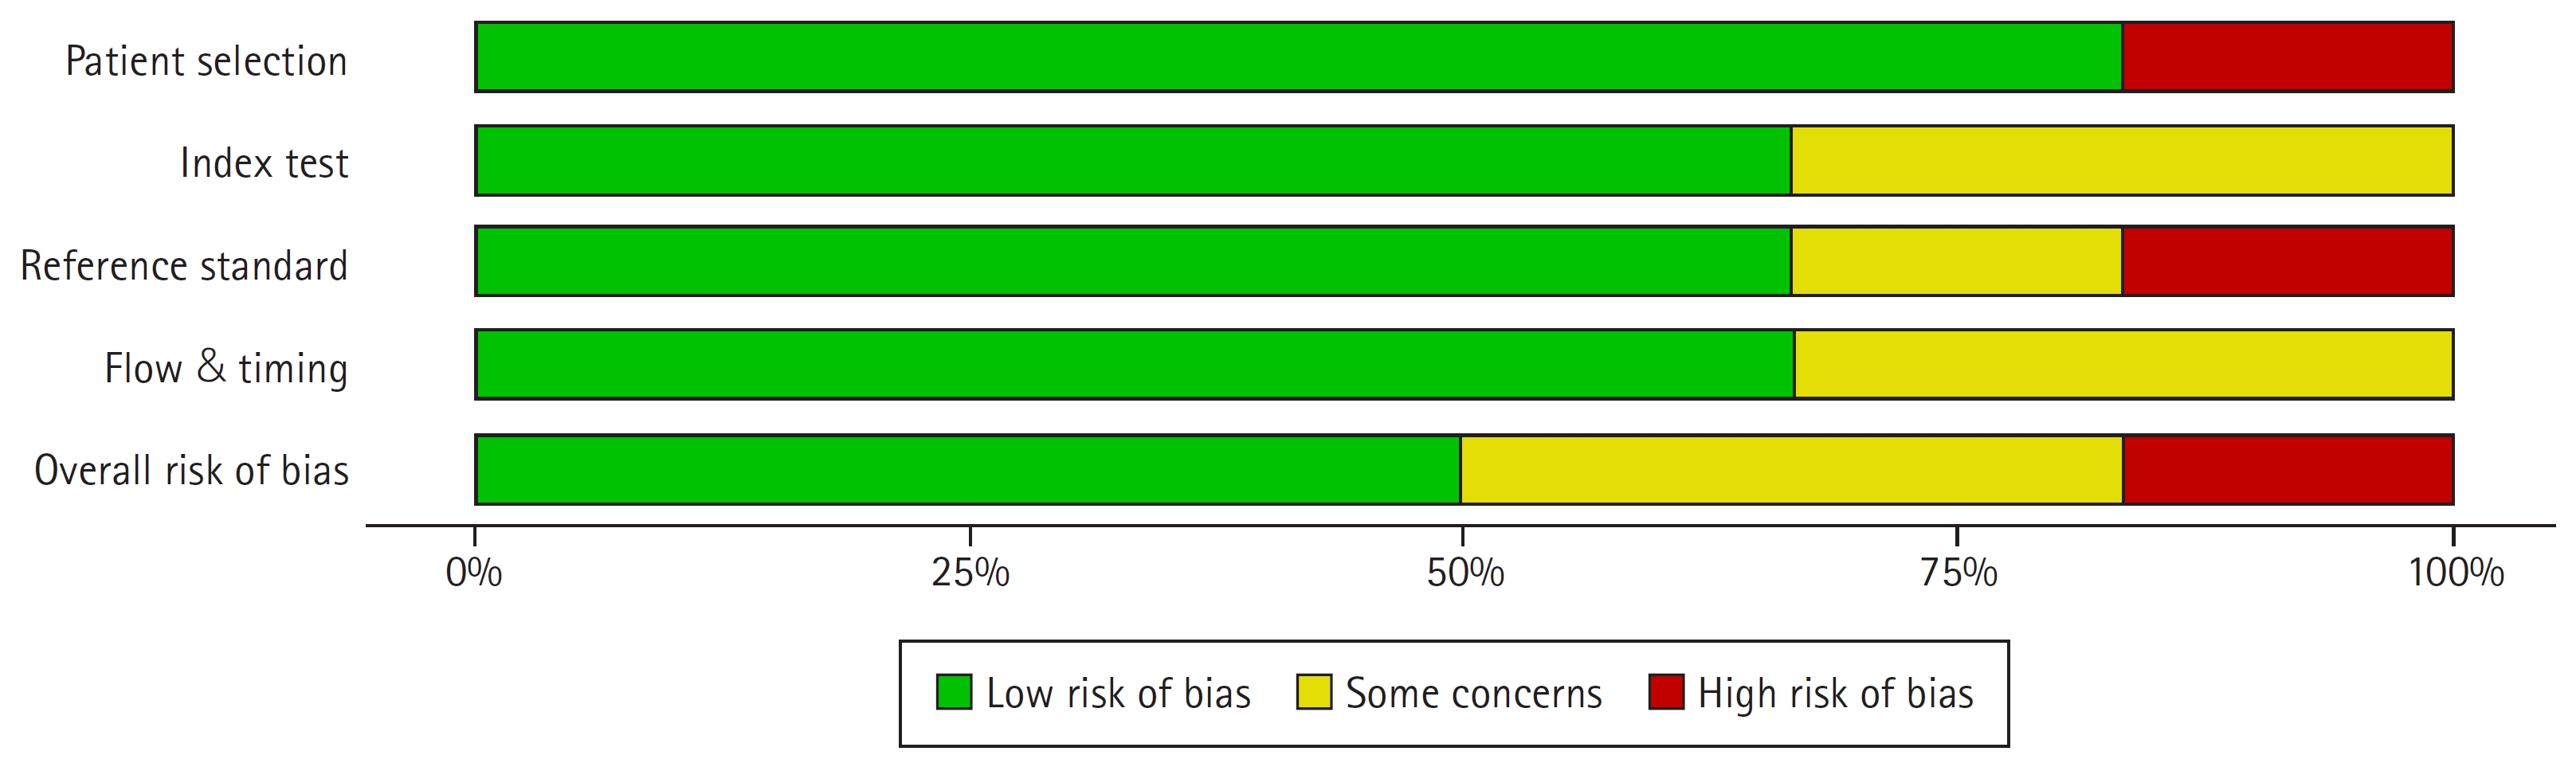
Assessment of study quality with the Quality Assessment of Diagnostic Accuracy Studies-2.
In the index test domain, all DCE-MRI parameters were described in detail, by three studies showed a risk of unclear bias because of the unspecified blinding process for the radiologists who assessed the DCE-MRI parameters [22-24]. In the standard reference domain, most studies clearly explained the criteria for evaluating tumor response clinically and radiologically except for one study [23]. Two studies in the flow and timing domain were deemed to have moderate/unclear risks of bias due to heterogeneous follow-up times. The treatment-response evaluation period was generally less than 3 months, indicating an early treatment-response evaluation [22,24].
3. Study characteristics
Seven studies evaluated tumor responses to RT using DCE-MRI parameters. These studies included 106 patients with spinal metastases and one patient with pelvic bone metastases. The features of each study are presented in detail in Table 1. All studies were published in four countries between 2013 and 2022: China, Singapore, South Korea, and the United States [22-28]. Four studies were prospective [23,25,27,28], while the others were retrospective [22,24,26].

Study characteristics of the included studies
This systematic review included 107 patients with various primary malignancies, of which the majority were lung, sarcoma, breast, and liver malignancies. Patients with spinal metastases were included in the study based on pathological features and clinical presentation. Due to poor image quality, patients who had undergone surgery and kyphoplasty in the area of metastases to be irradiated were generally excluded from the studies [22,24-27]. All patients in the seven included studies underwent RT, although with varied modalities of radiation delivery. Two studies used SBRT [26,27], two studies used EBRT [22,28], two studies used SRS [24,25], and one study used high-dose (HD) IGRT [23].
The tumor response to RT was evaluated using clinical and imaging criteria. Responder criteria were generally identical among the included studies with few differences [22-24,26,28]. Chu et al. [22] defined responders or treatment success based on evidence of tumor contraction (shrinking size of the outer borders of the abnormal signal lesion), negative results on positron emission tomographic-computed tomographic scans, or tumor stability in a long-term (more than 11 months without change). Post-treatment evaluation point was non-uniform, ranging from 10–187 days. Spratt et al. [26] described non-responders as a progressive radiographic size enlargement of the treated lesion and a persistent progression in more than one post-treatment scan with consideration of clinical features such as the progression of neurologic symptoms related to the treated site. The median time from SBRT completion to post-treatment DCE-MRI evaluation was 57 days (interquartile range, 51 to 62 days; range, 42 to 79 days). The study used a median follow-up time of 11.2 months to decide treatment failure/success.
Kumar et al. [24] described responders as those with no radiographic evidence of tumor recurrence in MRI and positron emission tomography (PET). Recurrent cases were defined as patients that showed progressive increase in the size of the treated lesion with consideration of the clinical scenario at a median follow-up time of 21 months. They did not clearly state the evaluation time-point after RT, however they did mention their earliest post-RT scan was 1 month, which did predict recurrence. Chen et al. [25] evaluated the tumor response using RECIST v1.1. The first post-RT evaluation was conducted 3 months after CyberKnife radiosurgery, followed by a 3-month cycle of follow-up examinations. In a median follow-up time of 18.6 months (range, 6.2 to 36.4 months) with a mean of 18.5 months, the patients were grouped in accordance with the evaluation results. Those patients with complete response (CR), partial responses (PR), or stable diseases (SD) were grouped into responders or non-progressive disease (non-PD). Patients with an increase in the sum of diameters of target lesions were grouped into non-responders or PD.
Vellayappan et al. [27] evaluated tumor response following the MD Anderson criteria at 3 months. Patients were subsequently divided into PD, CR, PR, and SD. Local recurrence was assessed in the median follow-up time of 42 months (range, 22.3 to 54.3 months) based on available clinical imaging at the last follow-up. Lis et al. [23] evaluated the tumor changes in spinal metastases patients undergoing HD IGRT immediately one hour after RT, which was then compared to the imaging results in long-term follow-up to further confirm the treatment response. The longest follow-up was 27.9 months. Lee et al. [28] evaluated the local tumor response based on MD Anderson criteria. The first evaluation time point was 1 month after RT (first post-RT; range, 15 to 45 days). The median follow-up time of 6 months (range, 3 to 7 months).
DCE-MRI parameters evaluation before and after therapy were performed on all the patients enrolled in the included studies. The first post-treatment DCE-MRI scan was generally conducted less than three months after the completion of RT [22-26,28]. A total of four studies used MRI with a magnetic strength of 1.5 T [22-24,26], and the three other studies used MRI at 3 T [25,27,28]. Detailed characteristics of the DCE-MRI parameters are shown in Table 2. All studies evaluated the Ktrans parameter [22-28], and five studies evaluated Vp [22-24,26-28]. Other parameters included Ve and Kep.

DCE-MRI parameter characteristics
The DCE-MRI protocol was similar in all studies. Gadolinium contrast was given at a rate of 2–3 mL/s and a dose of 0.1–0.2 mmol/kg. Image processing software was used to obtain pre- and post-processing data. Background noise was removed, spatial and temporal filtering was applied, and the aorta’s automatic arterial input function (AIF) was detected. Each patient’s AIF was calculated individually. Before proceeding with the next processing steps, the shape of the AIF curve was visually verified [22-28]. In five studies, DCE-MRI parameters were measured using the Tofts 2-compartment pharmacokinetic model [22-26,28], and only one study used distributed parameters (DP) [27].
4. Changes in DCE-MRI parameters and evaluation of tumor response after RT
1) Ktrans
This systematic review included all studies that examined changes in Ktrans after RT. Spratt et al. [26] demonstrated that around 2 months after SBRT, the DCE-MRI evaluation revealed a reduction in the mean Ktrans by up to 59% and a reduction in the maximum Ktrans by up to 55.2%. As much as 75% of lesions had a decrease in the mean Ktrans, and 92% of patients had a reduction in the maximum Ktrans. The mean and maximum Ktrans increased after SBRT in one patient with local recurrences (by 83.4%, and 9.5%, respectively). All patients with a 50% reduction in mean and maximum Ktrans after SBRT showed no local progression (median follow-up of 11.2 months; range, 5.1 to 31.1 months). However, this study did not compare the changes in responders and non-responders because of the small number of samples, so statistical significance was not obtained [26].
Kumar et al. [24] discovered a significant difference in post-SRS changes in Ktrans parameters between responders and non-responders (-66% vs. -7%; p = 0.01). At a median follow-up of 21 months (range, 5 to 40 months), no local recurrences were found in patients with a reduced post-SRS Ktrans by up to 66% (25 patients). Patients with local recurrences (five patients) showed only a 7% reduction in Ktrans (median follow-up of 14; range, 7 to 20 months).
Lis et al. [23] studied the early response after HD IGRT in six patients with spinal metastases. DCE-MRI parameters were assessed one hour before and after HD IGRT, and the results were compared. DCE-MRI parameters from 1 hour after HD IGRT were also compared to parameters at the first follow-up. The Ktrans parameter decreased at 1 hour after HD IGRT (median pre-therapy Ktrans of 4.84; median post-therapy Ktrans of 2.3; p = 0.06). There were no significant changes in the Ktrans parameter (p = 0.1) when comparing the first and subsequent follow-ups (range, 51 to 504 days), which was consistent with the evidence of no tumor growth found in imaging. In conventional MRI, all six tumors showed no local recurrence after up to 839 days of follow-up.
Chen et al. [25] reported similar findings. The responder group had a decrease in Ktrans parameters (-32.6%; range, -76% to -83.3%), whereas the non-responder group had an increase (Ktrans of 20.4%; range, -64.8% to 338%) in three months following RT. Statistically significant changes in Ktrans were noted (p = 0.001). Vellayappan et al. [27] assessed Ktrans levels at baseline, week 1, and week 12 following SBRT. Although not statistically significant (p > 0.05), the mean and median values of Ktrans after SBRT were subsequently reduced (mean baseline values of 12.08 and 3.65 [range, 0.03 to 62.49]; at week 1 of 3.10 and 2.66 [range, 0.01 to 10.55]; at week 12 of 1.30 and 0.92 [range 0.001 to 4.60], respectively). The study did not report a comparison of DCE-MRI parameters between responders and non-responders group since only one patient experienced local recurrence at 54 months of follow-up.
Chu et al. [22] investigated the use of DCE-MRI in predicting the response to therapy after RT. However, they did not specify the type of RT administered to patients (conventional or fractional RT or SBRT). The baseline evaluation time for DCE-MRI parameter values was 2–115 days, and the post-RT evaluation time was 10–187 days. There was no significant difference in Ktrans parameters before and after RT (p = 0.48).
Lee et al. [28] assessed changes in DCE-MRI parameters and their prognostic value after EBRT. The median time interval between the first DCE-MRI evaluation and the last RT was 30 days (range, 23 to 34 days). They found a decrease in Ktrans by -16.16% ± 45.60% (pre-RT of 135.38 [range, 43.51 to 346.0]; first post-RT DCE-MRI of 100.08 [range, 38.62 to 257.49]). However, the changes were not statistically significant. The median follow-up time was 6 months (range, 3 to 7 months). They found no significant differences in Ktrans (responders of 152.20 [range, 107.47 to 228.01]; non-responders of 96.94 [range, 43.51 to 346.04]) and ΔKtrans% between the PD and non-PD group (responders of -11.31 [range, -75.51 to 75.54]; non-responders of -30.74 [range, -72.97 to 31.48]), respectively.
2) Vp
A total of five studies evaluated changes in Vp parameters after RT [22–24,26,27]. Spratt et al. [26] reported that after SBRT, 92% of the 11 lesions in nine patients with spinal sarcoma showed a significant decrease in the mean Vp value by 58.7% and in the Vp maximum value by 63.2%. One lesion showed an increase in the mean and maximum Vp, but there was no local failure or progression of the lesion.
Chu et al. [22] found that the parameter Vp best predicts therapy response. There was a significant difference in Vp values after RT between tumor responders and non-responders (p = 0.01). Vp decreased by -65.66% (range, -21.31% to -99.26%) in 17 tumors that showed successful therapy, while Vp increased in two cases that did not (Vp of 145.27% and 206.79%). Kumar et al. [24] obtained comparable results. Tumor responders and non-responders showed a statistically significant difference in Vp values (-76% vs. +30%, p = 0.01).
Lis et al. [23] found a rapid and significant decrease by up to 65.2% in the Vp parameter 1 hour after HD IGRT (median Vp pre-SBRT of 15.14; median post-SBRT of 3.94). The perfusion parameters decreased at the subsequent follow-up, although the Vp reduction was not as dramatic as at 1 hour after SBRT. At 51–504 days, all patients had no tumor recurrence. Vellayappan et al. [27] reported no statistically significant change (p > 0.05) between mean and median Vp levels at baseline, 1 week after SBRT, and 12 weeks after SBRT (11.04 and 4.03 [range, 0.29 to 43.46]; 18.88 and 5.92 [range, 0.06 to 22.44]; 6.01 and 5.86 [range, 0.65 to 13.51], respectively). Lee et al. [28] reported that Vp changed by -49.74% ± 191.81% 1 month following EBRT (at baseline of 4.93 [range, 0.38 to 24.52]; 1 month of 2.86 [range, 0.21 to 33.35]). However, in a median follow-up time of 6 months, they found no significant differences in Vp between responders and non-responders (4.93 [range, 0.38 to 8.46] vs. 5.53 [range, 2.38 to 24.52]). Assessment of ΔVp% also showed similar results with no significant differences: -11.51 (ragne, -97.55 to 520.64) vs. -38.44 (range, -83.39 to 64.20) [28].
3) Ve
Chen et al. [25] found significant differences in Ve and ΔVe between responders and non-responders (0.22 [range, 0.08 to 0.44] vs. 0.17 [range, 0.10 to 0.27]; 27.8% [range, -31.6% to 282.2%] vs. -13.5% [range, -38.5% to 220.9%]). Vellayappan et al. [27] reported no statistically significant change between the mean and median Ve at baseline, 1 week after SBRT, and 12 weeks after SBRT (11.04 and 4.03 [range, 0.29 to 43.46]; 18.88 and 5.92 [range, 0.65 to 13.51]; 6.01 and 5.86 [range, 0.65 to 13.51], respectively). Lee at al. [28] reported significant increases of Ve by +161.9% ± 198.5% 1 month following RT (pre 161.54 [range, 128.38 to 410.13] vs. post 273.99 [range, 181.39 to 1,216.95]). Similar to Vp and Ktrans, in a median follow-up time of 6 months, Ve did not demonstrate significant increases between responders and non-responders group (195.00 [range, 135.30 to 368.89] vs. 148.30 [range, 128.38 to 410.13]), respectively. Assessment of ΔVe% yielded similar results (122.14 [range, 5.17 to 440.48] vs. 57.46 [range, -39.27 to 410.41]).
4) Other parameters
Chen et al. [25] reported that responders had considerably lower post-therapy Kep than non-responders (p = 0.024 and p = 0.001; -41.1% [range, -86.2% to 38.3%] vs. -6% [range, -42.8 to 68.4%]). Lee et al. [28] evaluated the changes in Kep 1 month following RT, which showed a significant decrease by -54.70% ± 32.21%. At a median follow-up of 6 months, there was no significant difference in Kep values between responders and non-responders (836.33 [628.82 to 1,082.32] vs. 741.29 [301.41 to 956.28], respectively). ΔKep values also did not show significant differences (-50.11 [range, -97.54 to -7.29] vs. -63.20 [range, -64.85 to -41.27]). Other metrics that can be determined from the SI curve include peak enhancement (PE) and area under the curve (AUC). According to Chu et al. [22], there was a substantial difference between the PE and AUC groups and between treatment failures and successes.
5. DCE-MRI parameters as an early predictor of tumor recurrence compared to conventional MRI
Kumar et al. [24] studied the difference in time to recurrence detection between conventional MRI and DCE-MRI. DCE-MRI detected local recurrences up to 18 months earlier than conventional MRI in five cases of recurrence (mean ± standard deviation, 6.6 ± 6.8 months) [24]. Chu et al. [22] demonstrated that the Vp parameter could detect a positive response to therapy within 10 days after treatment, which was significantly earlier than conventional MRI. DCE-MRI changes following RT could predict tumor response in less than 6 months, which is almost half the time required by conventional MRI to determine the outcome of therapy or tumor stability.
6. Diagnostic properties of DCE-MRI parameter changes in treatment response evaluation
Kumar et al. [24] analyzed the diagnostic properties of DCE-MRI parameters for detecting the recurrence of tumors. Ktrans and Vp had exceptionally high AUC values of 0.866 and 0.998, respectively. With a cutoff value of -50%, the Ktrans parameter demonstrated a good sensitivity, specificity, positive predictive value (PPV), and negative predictive value (NPV)—80%, 76%, 44%, and 94% respectively. In diagnosing local recurrence of cancers, the Vp parameter changes demonstrated a sensitivity of 100%, specificity of 98%, PPV of 91%, and NPV of 100% with a cutoff value of -20%.
Chen et al. [25] reported that Ktrans, Kep, and Ve metrics had relatively good diagnostic value. Ktrans had an AUC of up to 0.821 with a sensitivity of 83.3%, a specificity of 77.8%, and a cutoff value of 15.2%. Kep had an AUC of 0.818, a cutoff of -23.8%, a sensitivity of 91.7%, and a specificity of 70.4%. Ve was reported to have an AUC of 0.753 with a -11.2% cutoff, 66.7% sensitivity, and 88.9% specificity. Spratt et al. [26] examined a uniform cohort of 12 metastatic sarcoid spinal lesions undergoing SBRT. They reported that combining the perfusion changes of Ktrans and Vp could increase the accuracy up to 100% in predicting local recurrence in comparison to subjective assessments of tumor size and neuroradiological impressions using conventional MRI [26].
Discussion and Conclusion
Early detection of tumor response by noninvasive approaches is crucial, particularly in cases of spinal metastases, with which a delay in management may result in serious complications such as paralysis [26]. This systematic review highlights the current evidence regarding changes in DCE-MRI parameters as an early indicator of spinal metastatic tumor response following RT. The current evidence suggests that considerable changes in DCE-MRI parameters occur immediately after RT. These initial tumor changes are associated with the tumor response to therapy, as demonstrated by long-term clinical and imaging follow-up.
Compared to standard MRI techniques, DCE-MRI can yield helpful information regarding vascularity, tumor microenvironment, and tumor hemodynamics [23]. A quantitative evaluation of vascular characteristics can be derived using pharmacokinetic models of contrast uptake and measurements of signal intensity changes over time [23,29]. DCE-MRI metrics can detect changes in blood flow in lesions before and after therapy and signify a curative impact depending on the magnitude of changes in parameters before and after therapy. Ktrans, Vp, and Ve are the most typically evaluated parameters [25], with Ktrans representing contrast-agent transfer from the extravascular extracellular space (EES) to the vascular space, Vp reflecting intravascular volume, and Ve representing EES volume [30].
Ktrans can be used to determine the transfer rate of contrast agents from blood plasma to the extravascular-extracellular region, which is valuable for monitoring tumor response [31]. Unlike normal blood vessels, tumor blood vessels display elevated Ktrans and Kep values due to their elevated permeability and perfusion [32]. In most studies, there was a substantial difference between the post-radiation Ktrans values of responders and non-responders. Even though not all research achieved statistical significance, they all demonstrated the same tendency. Lower Ktrans levels and a substantial decrease in Ktrans were linked with treatment success [23-26].
The calculated intravascular volume is represented by Vp, and reductions in Vp values following RT suggest a decline in vascularity in lesions that respond favorably to therapy, whereas an increase in Vp values is observed in cases of treatment failure [22]. Ve is the EES volume per unit of tissue volume [30], and in contrast to Ktrans and Vp, which show an increase in the responder group, the included studies generally revealed a rise in Ve values in the responder group and a decrease in Ve values in the non-responder group [25].
Radiation can trigger the breakdown of tumor vascularization, thrombosis, fibrosis, and medial necrosis, which might disrupt the intratumor microenvironment and indirectly result in the death of tumor cells [33,34]. Decreased Vp and Ktrans values and increased Ve values in cases of successful treatment may be associated with the destruction of tumor vascularization [26], and reduced angiogenic activity due to large areas of post-RT fibrosis [35]. In the responder group, radiation damages the blood arteries of the tumor tissue, leading to a reduction in intravascular space volume and an increase in EES. This could account for the rise in Ve [30].
This systematic review reveals that patients with treatment failure generally exhibit a rise in Vp and Ktrans levels. The rise in perfusion parameters in cases of treatment failure could be related to the ability of viable and progressing tumors to emit angiogenesis-inducing substances such as vascular endothelial growth factor, which provide the essential vascularity for tumor growth [36]. Radiation-resistant cancers sustain less damage to the structure and function of tumor vascularization than radiation-sensitive tumors [25], which leads to fewer perfusion parameter changes among non-responders.
It is essential to decide the point at which DCE-MRI can be performed to provide the most accurate RT response and recurrence prediction. Lis et al. [23] reported the earliest time of post-treatment scans. Changes after RT could be detected as early as 1 hour after RT, showing a significant reduction in Vp values of up to 65.2% after RT. Ktrans also decreased, but not as drastically as Vp. Subsequent follow-up scans showed a continued decrease in perfusion (51–839 days after), but the decline in Vp was far less in subsequent follow-up studies. These significant changes in DCE-MRI parameters within 1 hour were reported to reflect treatment success in long-term follow-ups in the six patients.
Chu et al. [22] reported a positive treatment response of ΔVp values that could be detected within 10 days, which is much earlier than the report of stable disease with conventional imaging. Data on perfusion changes for other cases were obtained within 31–187 days after RT. Spratt et al. [26] found that changes in DCE-MRI values within 2 months post-SBRT could predict treatment success. Kumar et al. [24] reported that the earliest recurrence could be detected within 1 month in a group of patients with local recurrences. It may be possible to predict local recurrence at this early time interval and perhaps even earlier.
Kumar et al. [24] also compared the time interval between the first detection of tumor recurrences by Vp versus standard imaging. Vp could predict local recurrences up to 18 months earlier than standard MRI. Interestingly, they compared the time after RT to the percentage change in Vp, which showed no correlation in the local control group, but there was a trend toward a significantly positive correlation in the local recurrence group. This hinted at a plausible link between time and an increase in perfusion parameters for tumors that locally recur, which would be expected as tumors continue to grow over time.
Vellayappan et al. [27] reported that changes in Ktrans, PS, Vp, and Ve parameters could be detected in 1 week at the earliest, but they demonstrated changes in parameters that were more continuous and sustainable within 12 weeks. Similar to that report, Chen et al. [25] found that changes in parameters can be detected within 3 months with significant differences in ∆Ktrans, ∆Kep, and ∆Ve between the groups of responders and non-responders. Lee et al. [28] reported that changes in DCE-MRI parameters could be detected in one month after the completion of RT. However, in a median follow-up time of 6 months, these parameters did not show distinctions between responders and non-responders, which could have been due to the method of region-of-interest placement.
Based on this data synthesis, we hypothesize that post-RT changes can be detected within 1 hour after RT at the earliest, but they could show changes that are more continuous and sustained in the following weeks. Nevertheless, these data show that changes in perfusion parameters could be used to predict treatment success or failure earlier than 6 months after RT, which is nearly half the follow-up time required to determine successful treatment of a stable tumor using conventional MRI. This demonstrates that functional changes occur significantly earlier than structural alterations.
In clinical practice, early detection of response to therapy has numerous advantages. Patients with a poor response who are identified early might receive therapeutic adjustments immediately, thus optimizing their clinical outcome. Alternatively, rapid early recognition of a favorable response to therapy can lessen the stress and costs suffered by patients whose therapy is successful [22]. Several studies have reported the diagnostic accuracy of DCE-MRI parameters in predicting local tumor response, which all demonstrate a strong diagnostic value with an AUC value of around 0.753–0.998, a sensitivity of 80%–100%, and a specificity of 70%–98% [22,24-26]. Although both Vp and Ktrans were shown to have good diagnostic value in predicting response to therapy, Kumar et al. [24] demonstrated that Vp was more accurate than Ktrans.
It is worth noting that there could be distinctions in how different RT methods could influence response evaluation using DCE-MRI. As we know, the limitation of EBRT has led to the development of more advanced and precise RT techniques [37,38]. Recently, emerging evidence has strongly implied a different mechanism of SBRT and SRS in the process of killing tumor cells, compared to the conventionally fractionated RT. SBRT and SRS not only directly kill tumor cells, but also destroy the tumor vascular beds, leading to a deteriorated intratumor microenvironment and subsequently indirect tumor cell death [37]. This theory is backed by considerable preclinical data [37,39,40]. A novel vascular-mediated cell-killing method via the ceramide pathway is associated with the mechanism of action of SBRT and SRS in killing tumor cells [38]. A radiation dose more than 8 Gy per fraction can trigger secretory ASMase translocation from the cytosol to the glycosphingolipid contained in the outer leaflet of the plasma membrane. In turn, this can hydrolyze sphingomyelin into ceramide, which is a pro-apoptotic second messenger molecule. Endothelial cells contain a large amount of secretory ASMase (nearly 20 times more than any other cell in the body), so they are more susceptible and sensitive to ceramide-mediated and radiation-induced apoptosis [39,40]. Consequently, in tumor response evaluation to RT, it is not farfetched to conclude that DCE-MRI evaluation using perfusion metrics can be more biologically relevant when judging treatment response to SBRT in comparison to conventionally fractionated RT.
This systematic review has several drawbacks. Only a small number of studies are included in systematic reviews, and this one included only six papers with small sample sizes. The subjects included in the study generally had heterogeneous primary tumors and were treated with various RT techniques and radiation doses, which could influence the outcomes of DCE-MRI parameter measurements. In addition, we could not avoid the heterogeneity of tumor histology and inconsistent follow-up MRI examinations. There are also some technical considerations in interpreting the study results, which could also be potential factors for the different study results, such as scanners, software, or operator-dependent variabilities, which are known constraints in DCE-MRI application. In addition, to achieve a correct quantitative analysis using DCE-MRI, pre-contrast T1 and AIF must be evaluated accurately. This must be acknowledged when interpreting these studies. In DCE-MRI parameter acquisition, high temporal resolution, coverage, and signal-to-noise ratio frequently result in insufficient temporal resolution for accurately calculating AIF. Due to low temporal resolution, a low sample rate can impact the AIF time and the early wash-in process of the contrast agent [22,23].
Nonetheless, this systematic review also has several strengths. This is the first systematic review to synthesize the current evidence regarding DCE-MRI parameters for evaluating the tumor response in patients with spinal metastases after RT. Despite the study's limited capability, the results are noteworthy because they show the potential of DCE-MRI characteristics as early non-invasive markers of response to treatment, which are useful much earlier than the current standard evaluation method using conventional MRI.
In conclusion, despite the diversity of available studies, this systematic review highlighted that most DCE-MRI studies indicate a role for changes in DCE-MRI parameters as biomarkers of early tumor response following RT in patients with spinal metastases. Responders show lower values and higher reduction of Ktrans and Vp after therapy, demonstrating that these values are good predictors of local control. Long-term prospective studies with larger study samples, more homogeneous primary tumors, and more uniform DCE techniques are still needed to provide further evidence of DCE-MRI's significance as a predictor of post-RT spinal metastatic tumor response.
Notes
Statement of Ethics
As this study did not involve any human subjects, Institutional Review Board approval and informed consent were not required.
Conflict of Interest
No potential conflict of interest relevant to this article was reported.
Funding
None.
Author Contributions
Conceptualization, Mulyadi R. Investigation and methodology, Mulyadi R, Putri PP, Handoko, Zairinal RA, Prihartono J. Writing of the original draft, Mulyadi R, Putri PP, Handoko, Zairinal RA, Prihartono J. Writing of the review and editing, Mulyadi R, Putri PP, Handoko, Zairinal RA, Prihartono J.
Data Availability Statement
Data availability statements provide a statement about where data supporting the results reported in a published article can be found.