


Introduction
Radiotherapy has been widely regarded as an alternative treatment for inoperable liver cancer [1234]. Image-guided stereotactic ablative radiotherapy (SABR), with its accurate and precise tumor targeting, has been a safe and effective modality for the treatment of liver cancer [567]. With radiotherapy, the change in liver volume after therapy was not significant [8], and regeneration of reduced liver volume occurred 6 months after radiotherapy [9]. However, radiation-induced liver toxicity is clearly affected by high dose irradiation [3810].
The focal liver reaction (FLR) in the region exposed to the high dose of radiotherapy was reported to occur within the first few months after therapy and appeared as a radiological change on computed tomography (CT) [21112]. In order to evaluate the threshold dose (TD) for developing FLR, follow-up liver CTs and dose-volume histograms (DVH) have been evaluated from SABR treatment plans [131415]. Interestingly, a linear correlation between dose and FLR hypodensity in the liver CT images was found [16].
Magnetic resonance imaging (MRI) enhanced with gadoxetate disodium-gadolinium ethoxybenzyl diethylenetriamine pentaacetic acid (Gd-EOB-DTPA; Promovist, Bayer Schering Pharma AG, Berlin, Germany) was superior to the CT-generated images for detecting and characterizing hepatocellular carcinoma (HCC) [17]. This advantage is likely due to Gd-EOB-DTPA's gradual uptake by hepatocytes, and it is eventually excreted via the biliary pathway after intravenous injection. Therefore, the hepatobiliary phase images of Gd-EOB-DTPA-enhanced liver MRI might provide further understanding of radiation induced FLR.
The hepatobiliary phase of Gd-EOB-DTPA-enhanced MRI taken 20 minutes after injection may assess the quantitative hepatic function of the liver parenchyma potentially [181920]. FLR, that is a well-demarcated focal hypodensity of liver parenchyma in the region exposed to the high dose [21], could be observed on hepatobiliary phase of Gd-EOB-DTPA-enhanced MRI [2122], and TD for developing FLR has been evaluated for both single fraction brachytherapy [22] and SABR with a prescribed dose of 35–40 Gy in 5 fractions [21].
However, as the signal intensity of Gd-EOB-DTPA-enhanced liver MRI was not calibrated or quantified for hepatic function, the volume of FLR was identified by a physician on Gd-EOB-DTPA-enhanced MRI in the studies, and TD was obtained with the DVH analysis [2122]. Although use of MRI could increase accuracy of target delineation [23], inter- and intraobserver variation still exist [242526]. In the methods of the DVH analysis, as the volume of FLR was determined by the physicians, inter- and intraobserver variation could affect the determination of the TD. In order to evaluate a patient-specific TD for developing FLR using Gd-EOB-DTPA-enhanced MRI and reduce uncertainty due to inter- and intraobserver variation, we suggested a novel method that calculates automatically the relationship between the dose delivered to the normal liver and the change in signal intensity of the hepatobiliary phase of Gd-EOB-DTPA-enhanced-MRI acquired before and after SABR for liver cancer. We then deduced individual TDs from the relationship in this paper. The feasibility of this method was evaluated for six patients.
Materials and Methods
1. Patient characteristics
We retrospectively reviewed the medical records of patients with HCC treated with SABR between 2012 and 2013 at Samsung Medical Center. We found six patients who underwent Gd-EOB-DTPA-enhanced MRI scans within 4 months before and after SABR for HCC. This study was approved by the Institutional Review Board of Samsung Medical Center.
All the patients were positive for serum hepatitis B virus antigen and had liver cirrhosis. They had received one or more treatments before SABR, such as surgical resection, radiofrequency ablation (RFA), transarterial chemoembolization (TACE), or radiotherapy (RT). Although patients had relatively small lesions (range, 1.3 to 2.2 cm) and they were all Barcelona Clinic Liver Cancer (BCLC) classification system A, they were not qualified for standard curative therapies like resection, liver transplantation, or RFA, and, thus SABR was used as an alternative salvage modality.
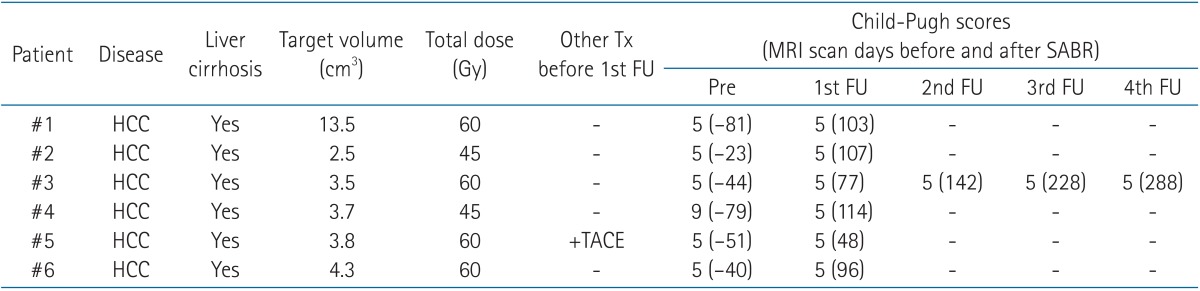
The Child-Pugh score for patient #4 was 9, and the score for the others was 5. Patients were not treated by other modalities during follow-up, except for one patient. For patient #5, another cancer in the liver was treated by TACE during the time between the completion of the SABR and the first follow-up imaging. All the patients were male, and the median age was 63.5 years (range, 58 to 73 years). The patients' characteristics are summarized briefly in Table 1.
2. Simulation and treatment plans
Respiratory motion of all the patients was monitored before the CT simulation using a respiration monitoring system (Real-Time Position Management; Varian Medical Systems, Palo Alto, CA, USA), and the most reproducible period of the respiration was decided individually. Then, the visual prompting device, on which a guiding wave with the patients' specific respiration period was displayed, was supported to the patients during the entire simulation and treatment process. Patients were educated and trained to control their respiration reproducibly and regularly before the beginning of the simulation.
The contrast-enhanced biphasic CT images were acquired when the patient held their breath in complete exhalation, then, free-breathing four-dimensional (4D)-CT scans were acquired with the visual prompting device. The 4D-CTs were sorted to the 10 phase bins retrospectively. In all of the CT scans, the patients were positioned supinely with both arms raised. A multi-slice CT scanner (LightSpeed RT16; GE Healthcare, Waukesha, WI, USA) and the respiration monitoring system were used. CT scan dimensions were 512 × 512 with pixel spacing of 0.879 mm, and the slice thickness was 2.5 mm.
3. Magnetic resonance imaging
The hepatobiliary phase MRIs analyzed in this study were obtained using an Achieva 3.0T whole body MRI (Philips Healthcare, Best, The Netherlands) equipped with a 16-channel phased array coil, which was the SENSE torso coil and was used as the receiver coil. The hepatobiliary phase images of contrast-enhanced MRI were acquired 20 minutes after the Gd-EOB-DTPA contrast medium injection with a flow rate of 2 mL/s and a dose of 0.025 mmol/kg body weight. The sequence of the T1-weighted fat-suppressed three-dimensional gradient echo sequences (enhanced T1 high resolution isotropic volume excitation, repetition time = 1.5 ms, echo time = 3.1 ms, and flip angle = 10°) was used. All the hepatobiliary phase images were acquired when the patient held their breath in complete exhalation. The patients were positioned with their arms at their sides in the supine position on a concave surface. All image dimensions were resolution of the images was 320 × 320, and the slice thickness was 4.00 mm. Because the field-of-view of the MR scans was determined individually in order to guarantee full abdomen coverage, pixel spacing varied from 1.06 to 1.17 mm.
A total of 15 Gd-EOB-DTPA-enhanced hepatobiliary phase images for six patients were analyzed. As shown in Table 1, six pretreatment MRI acquired a median of 48 days before SABR (n = 6; range, 23 to 81 days) were used as the baseline images. The first follow-up images were acquired a median of 100 days after SABR (n = 6; range, 48 to 114 days). FLR was analyzed from the first follow-up images, and for patient #3, FLRs on consecutive follow-up images were analyzed in order to investigate time-dependent changes in FLR.
4. Treatment plans and radiotherapy
The end-exhale CT image from the 4D-CT was used as planning CT. The bi-phasic CT and planning MRI were rigidly registered to the end-exhale CT images, and target volumes, including gross tumor volume and clinical target volume, were delineated on the end-exhale CT images. Internal target volume (ITV) was determined by merging the target volumes delineated on the phase images within a gating window of 40%–60%. Planning target volume was determined by adding a setup margin of 5.0 mm to the ITV.
A treatment plan using Pinnacle3 (Philips Healthcare, Fitchburg, WI, USA) was conducted with 5–6 photon fields with a nominal energy of 10 MV using the end-exhale 4D-CT images. The median value of D95% (percent dose delivered to 95% of the target volume) was 98.9% of the prescription dose (range, 98.3% to 102.8%). The mean dose delivered to the normal liver was 6.5 Gy (range, 2.7 to 9.9 Gy), and V20 Gy (percent volume of the normal liver enclosed by an isodose line of 20 Gy) was 8.8% (range, 3.2% to 16.4%). The prescribed dose for the two patients (patients #2 and #4) was 45 Gy, and for the others, the dose was 60 Gy in 3 fractions over 3 to 5 days, as seen in Table 1.
All patients were treated with a Novalis Tx equipped with the RPM and On–Board Imager (Varian Medical Systems). Gating technique with a duty cycle of 40% to 60% and daily image-guided radiotherapy using exhale-phase gated orthogonal kV images and cone-beam CT were used in all the treatments.
5. Dose and focal liver reaction relationship
A physician registered sets of MRIs, including both pretreatment and follow-up hepatobiliary phase images of Gd-EOB-DTPA-enhanced-MRI, to planning CT images with a manual rigid body transformation followed by an automated rigid body transformation using a commercial software package (Mirada RTx; Mirada Medical, Oxford, UK), and then, the registration was peer-reviewed by a physicist. Although Mirada RTx can register MR to CT nonrigidly, deformable image registration (DIR) was not conducted in this study. In order to evaluate registration and observe changes in liver volume, a physician calculated dice's coefficient (DSC) across the whole liver, which was assessed using the planning CT and MRI.
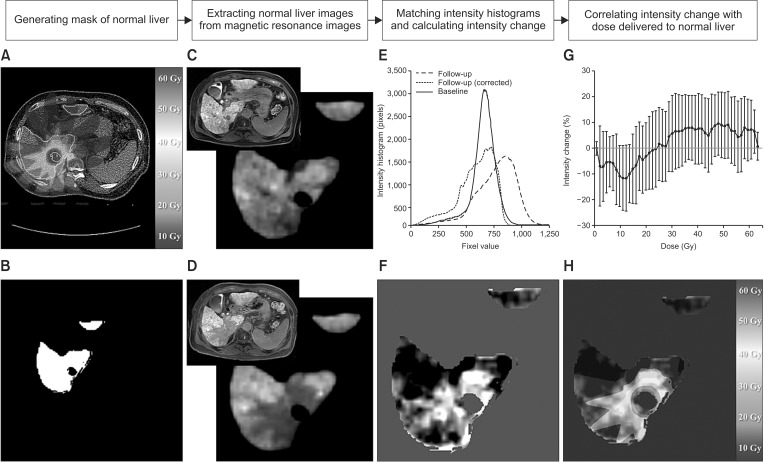
We suggested a novel method for automatically obtaining patient-specific TDs for developing FLR. An in-house software program was developed in MATLAB (MathWorks, Natick, MA, USA), and the program correlated the three-dimensional dose from the treatment plan to the change in signal intensity of each pixel between pretreatment and follow-up MRI. Then, patient-specific TDs could be obtained from the results of the curve mapping the relationship to a sigmoidal function. Fig. 1 is a brief scheme of the method.
The three-dimensional volumes of normal liver on MRI, which were already registered to the planning CT, were extracted using the contour of the normal liver from the treatment plan (Fig. 1A–D).
Although signal intensity of the MRI represents the liver parenchyma function, the signal intensity of Gd-EOB-DTPA-enhanced MRI was not calibrated, as Hounsfield unit (HU) was on CT. The signal intensity on pretreatment MRI was much different than the intensity on the follow-up MRI, as shown in Fig. 1E. Because high dose region occurring FLR was planned to be the small volume in SABR, we assumed that almost all of the liver parenchyma could be preserved. Each intensity histogram of the normal liver on pretreatment and follow-up MRI was calculated, and then the intensity histogram was adjusted to match the peak intensity on pretreatment MRI to the intensity of the follow-up MRI. This allowed calculation of the change in intensity between pretreatment and follow-up MRI, as shown in Fig. 1E.
The intensity change of each voxel was calculated by subtracting the intensity on follow-up MRI from the pretreatment MRI (Fig. 1F). The dose delivered to the normal liver was correlated to the changes in intensity by averaging the intensity changes corresponding to dose bin (Fig. 1G and H), as follows:
where ΔIR is the change in intensity of each voxel located at R in Cartesian coordinates between pretreatment and follow-up images, I R Pretreatment Image I R Follow-up Image I R Pretreatment Image
We assumed that the relationship was a sigmoidal function. In order to obtain the TD for the development of FLR, the relationship between dose and changes in intensity was fitted to a Boltzmann function, as seen in Eq. (3).
where A1 and A2 are the bottom and top of a fitted curve, respectively, and dx and x0 are the slope of the curve and the center of the slope, respectively.
The FLR was sharply demarcated and distinguished radiologically from normal liver by its hypointensity. We defined the center of the slope from the fitted dose-intensity change relationship, x0, was to be the TD. In order to evaluate the TD using this method, a physician and physicist delineated the volume of the FLR, VFLR, on follow-up MRI, with consensus. The TD calculated from the curve, Vx0, was evaluated by comparing concordance between VFLR and Vx0 [13], as shown by Eq. (4).
Where VFLR and Vx0 is the volume of the FLR identified by a physician and the volume of normal liver enclosed by an isodose line of TD, x0, respectively.
Results
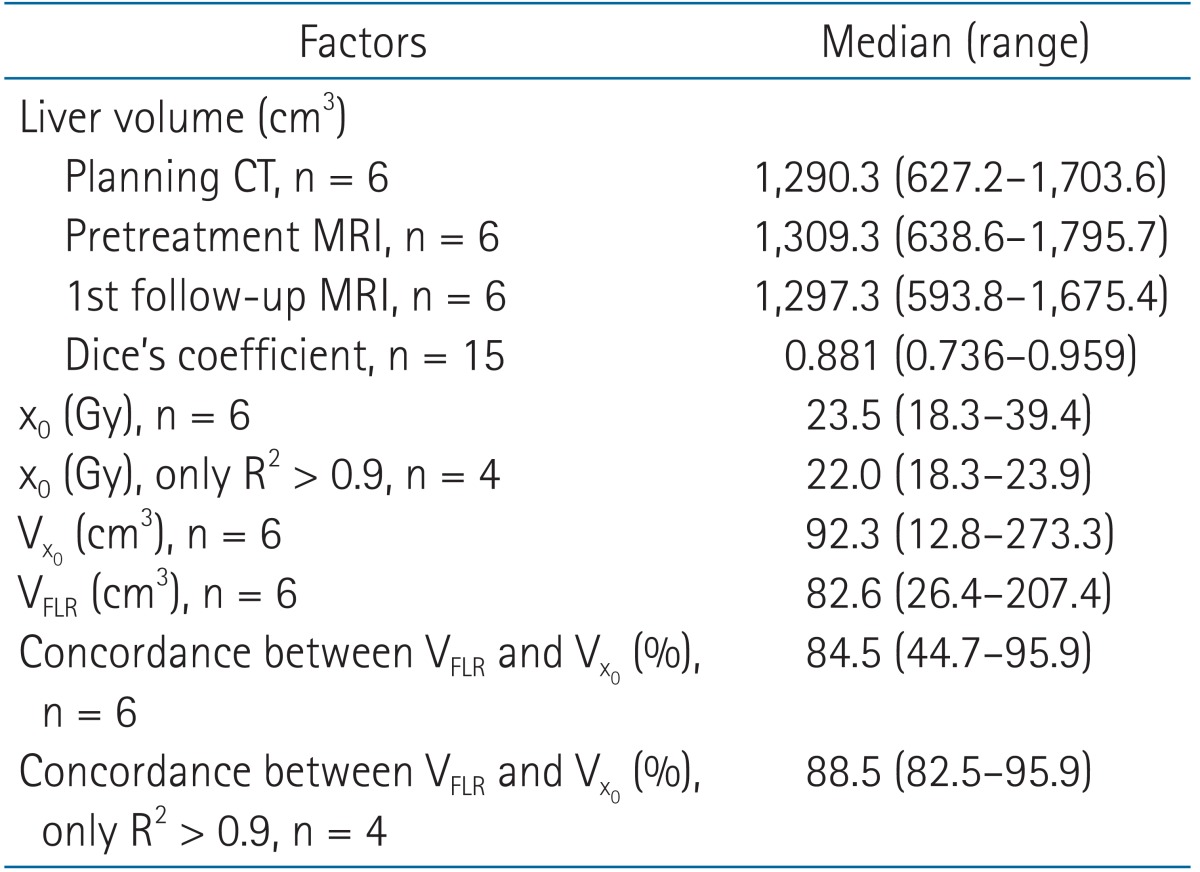
The volumetric parameters, including the volumes of the whole liver, FLR, and DSC, are summarized in Table 2. When using the Friedman test with SPSS ver. 22 (IBM, Armonk, NY, USA), there were no significant changes in the whole liver volumes assessed on planning CT, pretreatment MRI, and first follow-up MRI after SABR (n = 6, p = 0.115). The median whole liver volume DSC value on planning CT and MRI scans, which may represent the agreement of the liver volume on each registered MRI and CT, was 0.881 (range, 0.736 to 0.959).
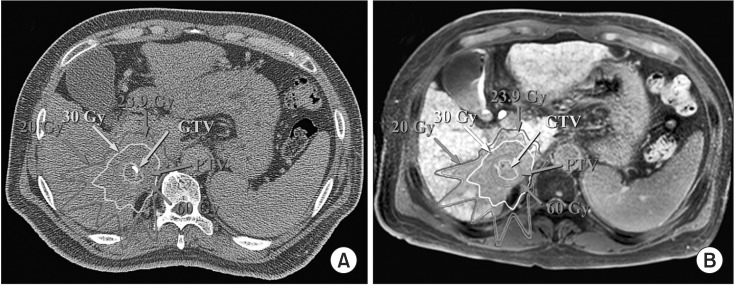
A set of planning CTs and first follow-up MRI images for patient #6 with target volumes and isodose lines of 20–60 Gy, in addition to the calculated TD using this method, are presented in Fig. 2. The isodose line of the TD (23.9 Gy) calculated with our method was well matched to the shape of the FLR on follow-up MRI, as shown in Fig. 2B.
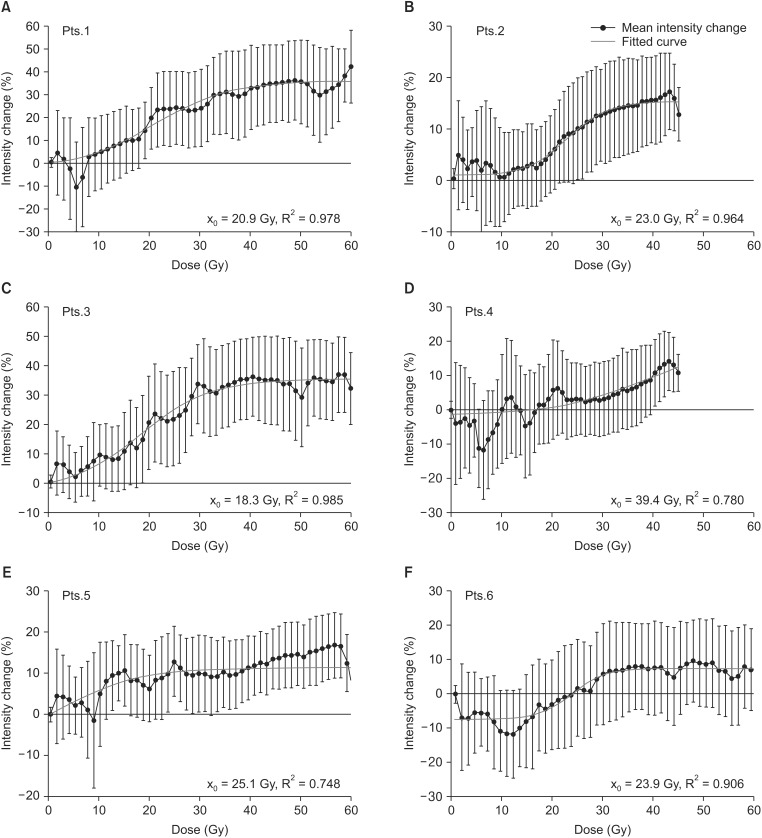
Fig. 3 shows the mean change in intensity between pretreatment MRI and the first follow-up MRI according to increasing doses delivered to the normal liver for all patients. The intensity changes for all patients seem to increase with increasing doses. Specifically, for four patients, the relationship between the dose and the intensity change was fitted successfully with an R2 of over 0.9. The median TD, x0, were 23.5 Gy (range, 18.3 to 39.4 Gy) and 22.0 Gy (range, 18.3 to 23.9 Gy) for all patients and for the mentioned four patients (R2 > 0.9), respectively. As the R2 is a statistical measure of how close the data are to the fitted regression line, R2 means the geometrical similarity between the volume enclosed by the isodose of TD by the method and regions of the intensity change.
Concordance between the FLR volume identified on the first follow-up MRI by a physician and the volume enclosed by the TDs (x0) had a median value of 84.5% (range, 44.7% to 95.9%) for all patients (n = 6), as summarized in Table 2. For the cases with R2 of less than 0.9, patients #4 and #5, the concordances were 44.7% and 73.6%, respectively. However, when considering cases with TDs with R2s greater than 0.9 from the curve fitting, the median concordance was 88.5% (range, 82.5% to 95.9%).
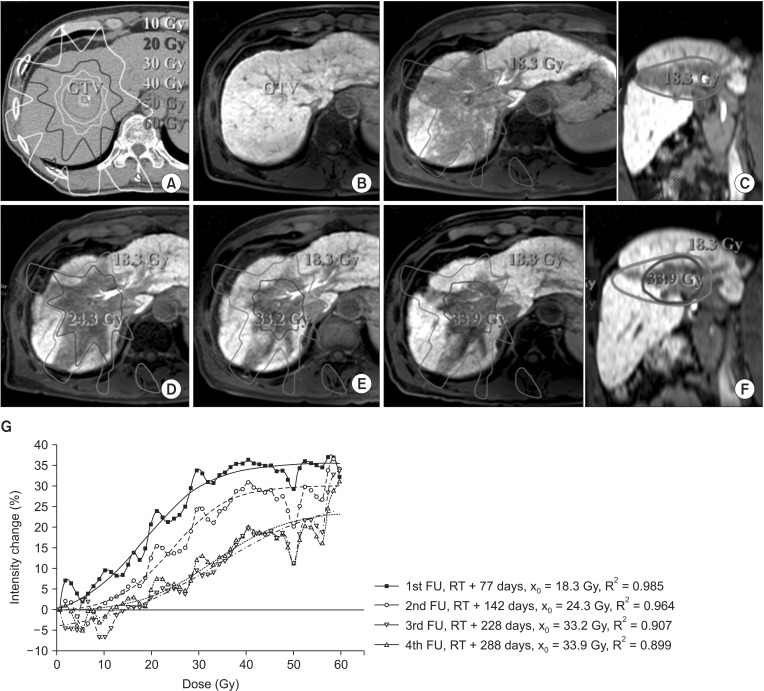
The time-dependent changes in FLR on consecutive follow-up MRI scans for patient #3 were evaluated. The TD on first follow-up MRI acquired 77 days after SABR was 18.3 Gy with a concordance of 95.9%, as shown in Fig. 4C. The consecutive follow-up MRI scans were conducted 142, 228, and 288 days after SABR, and the FLR volume decreased with follow-up time, as shown in Fig. 4D–F. TDs on the second through fourth follow-up MRI scans were evaluated to be 24.3 Gy, 33.2 Gy, and 33.9 Gy, and the concordances between FLR identified by our method and the physician were 73.6%, 54.8%, and 53.3%, respectively, as shown in Fig. 4G. The correlations and concordances and geometrical similarity, R2, were reduced with longer intervals between SABR and follow-up. In addition, it can be observed that the signal intensity in the regions exposed to dose less than 56 Gy was regained slightly over the follow-up time. However, the signal intensity in the regions exposed the prescribed dose was preserved.
Discussion and Conclusion
The relationship between dose and FLR for the six patients who underwent SABR for HCC was evaluated by analyzing the changes in intensity of the hepatobiliary phase images on Gd-EOB-DTPA-enhanced MRI. One limitation of this study is that the number of the patients was insufficient to statistically assess the TD for developing FLR after SABR for liver cancer, and another limitation was to evaluate the registration between CT and MRI based on volumetric method, Dice's coefficients without evaluation of difference in landmarks. However, the scope of this study was to suggest a novel method that automatically calculates an individual's TD for developing FLR based on analyzing changes in normalized signal intensity between pretreatment and follow-up MRI, and to evaluate the feasibility of this method.
FLR following SABR and single fraction brachytherapy has been observed to be a sharply demarcated area of hypodensity corresponding to a high-dose area on follow-up multiphasic CT [13141516]. The quantitative change in HUs corresponding to the dose has been previously reported using CT images [141516]. In addition, the TD for developing FLR that is visible on the hepatobiliary phase of Gd-EOB-DTPA-enhanced MRI has been evaluated using DVH analysis [2122]. Although the region of FLR on the hepatobiliary phase of Gd-EOB-DTPA-enhanced MRI may be demarcated well than CT, the signal intensity of Gd-EOB-DTPA-enhanced MRI was not calibrated as like HU of the CT. Thus, the TD was determined to be dose achieved in at least 90% of the volume of FLR identified by a physician [22], or TD was determined based on the dose axis of DVH data from the treatment plan such that the volume of normal liver irradiated more than the TD was equivalent to the volume of FLR identified by a physician [21].
On the other hand, using the method suggested in this study, the TD was determined based on the relationship between the dose matrix from the treatment plan and the change in intensity of normal liver on pretreatment and follow-up MRI. Therefore, it is expected that this method can reduce the uncertainty of determining the TD and FLR volume due to inter and intraobserver variation. Also, this method can evaluate potentially the quantitative relationship between radiological changes and the dose delivered to normal liver parenchyma individually. Thus, it could aid in understanding radiological changes corresponding to hepatocyte function revealed on MRI following radiotherapy.
The median concordance between the FLR identified by a physician and the volume enclosed by isodose of TD determined by the method in this study was 84.5% (range, 44.7% to 95.9%) for all patients. For the four patients with good correlation between dose and intensity change (R2 > 0.9), the concordance was 88.5% (range, 82.5% to 95.9%). Sanuki et al. [21] and Takeda et al. [13] reported that the median concordances based on DVH analysis were reported to be 84.9% (range, 71.6% to 95.4%) using hepatobiliary phase images of the Gd-EOB-DTPA-enhanced MRI and 80.5% (range, 70.8% to 92.4%) using portal-venous phase CT, even though patients with concordance less than 70% were excluded. In addition, because TD from DVH analysis was calculated based on the equivalent volume only, geometrical similarity between the volume identified by a physician and enclosed by isodose line of TD from DVH analysis could not be validated. However, in our method, when the geometrical similarity was decreased, then R2 from the curve-fitting was also decreased. Thus, we expect that the accuracy of our method for calculating patient-specific TD is comparable or superior to DVH analysis.
The minimal changes should be observed in the low dose region theoretically, however, a positive or negative relationship was observed for the some patients, as shown in Fig. 3. Although it has limited that the signal intensity of Gd-EOB-DTPA-enhanced MRI is directly used for evaluation of liver function due to lack of the quantitative calibration, the signal intensity may potentially represent the hepatocytes of the liver parenchyma [2728]. The methods, which may calibrate signal intensity of liver parenchyma on the Gd-EOB-DTPA enhanced MRI using signal intensity of spleen or muscle, have been reported [2930]. However, as normal liver volume enclosed by isodose line of less than 20 Gy was more than about 80%, we assumed that hepatocyte function of the almost normal liver was not injured by the SABR and the peak intensities on the pretreatment and follow-up MRIs could represent the preserved hepatocyte function. According to the assumption, the intensity histogram of each MRI was normalized and rescaled by its own peak intensity. When change in hepatocyte function in large volume of liver parenchyma would be occurred by other factors during follow-up period, e.g., another treatment, the amount of peak intensity and shape of intensity histogram could be changed. Then, because of the assumption, negative or positive relationship could be observed. Recently, a novel techniques, such as T1-relaxometry which may be useful method for assessing overall and segmental liver function [31], has been developed and the adaptation of the T1-relaxometry into our algorithm would increase the accuracy of the TD for developing FLR by our method.
Our method can calculate TD for developing FLR for the four patients with good correlation between dose and intensity change (R2 > 0.9) successfully. However, for patient #4 and #5, the relationships derived from the Boltzmann curve fitting were not statistically significant, with R2 of 0.780 and 0.748, respectively. It means that the isodose line of the TD by the method and was geometrically not similar to the volume of FLR, and the concordance was 44.7% and 73.6%, respectively. For patient #4, the Child-Pugh score was 9 before SABR, but the Child-Pugh score after SABR was decreased to 5. For patient #5, the liver cancer located in the left lobe was treated by SABR, and a low dose less than 5 Gy was delivered to the right lobe. In addition, another tumor in the right lobe was treated by TACE during the time between the completion of the SABR and the follow-up MRI scans. It is possible that the TACE may affect the hepatic function on the right lobe and diminish the signal intensity surrounding treated volume as like FLR [32]. For patients #4 and #5, as shown in Fig. 2D and E, respectively, the dose over 20 Gy may correlate to the intensity change well, and the volume of FLR could also be well delineated by a physician. The poor baseline characteristics, including Child-Pugh B or liver cirrhosis, or the other treatments may affect the signal intensity of Gd-EOB-DTPA-enhanced MRI and then, the poor relationship between dose and change in the signal intensity in the low dose, especially less than 20 Gy, may result consequently.
In addition, the standard deviation of the intensity change was not small in comparison to the mean intensity change. The standard deviation may be a result of the uncertainty of the signal intensity in the normal liver on MRI and due to geometric uncertainty of the registration. The signal intensity of the normal liver parenchyma with healthy hepatocyte function is intrinsically enhanced compared to the structures without hepatocyte function in the liver, such as vessels. The median standard deviation of the mean signal intensity of all structures in the liver on six pretreatment MRIs, which were used as the baseline images, was 18.9% (range, 16.2% to 23.2%).
Because the sets of MRI were rigidly registered to the planning CT scans, the uncertainty of the relationship between dose and signal change could be affected by the uncertainty of local registration. Geometrical uncertainty of the registration may be caused by the changes in respiratory motion during image acquisition and changes in volume and structure of the liver on follow-up MRI. In our institution, the end-exhale CT from the 4D-CT was used as the planning CT, and the pretreatment and follow-up MRI were acquired during exhale breath-hold in order to minimize respiration induced artifacts. Although the respiration induced uncertainty was minimized, the geometric mismatch of structures in the liver, e.g., vessels, could be observed on pretreatment MR, planning CT, and follow-up MRI. The patient's position with arms at their sides during the pretreatment and follow-up MR scans was not the same during the planning CT, in which the arms were raised.
Although the liver volumes determined on the pretreatment MR, planning CT, and follow-up MR were not changed significantly, regeneration of the normal liver after SABR may cause structural change internally. We tried to nonrigidly register the pretreatment and follow-up MRI to the planning CT image using commercial software, which provided the DIR of the MR to CT functionally, however, the existence of the FLR with hypointensity volume on the follow-up MR, which did not exist on the pretreatment MRI and planning CT, caused an unanticipated distortion of the pretreatment MR and planning CT by DIR. Therefore, DIR was not used in this study. When DIR of follow-up and pretreatment MRI to planning CT could be performed without distortion, DIR would be able to increase the accuracy of the image registration.
The accuracy of the TD obtained using our method can be affected obviously by the accuracy of the registration between the planning CT, pretreatment MRI and follow-up. The evaluation of difference in landmarks in the liver on the images can represent the accuracy of the registration well. However, in this study, the accuracy of the registration was evaluated using Dice's coefficient, which can quantify coincident of the liver volume between the planning CT, pretreatment MRI and follow-up. In order to ensure the accuracy of the registration, all the registrations were reviewed by the physician and physicist individually. In addition, we previously reported that discrepancies in the rigid registration between the endexhale phase CT and exhale phase gated MRI acquired for the treatment planning on the same day was approximately 5 mm based on comparison of landmarks in liver [33].
Using our method, the median TD for developing FLR following SABR with 3 fractions for six patients was evaluated to be 23.5 Gy (range, 18.3 to 39.4 Gy) in this study. The TDs were reported 13.7 Gy (range, 8.9 to 19.2 Gy) and 28.0 Gy (range, 22.3 to 36.4 Gy) for SABR with single-fraction [15] and 5 fractions [21], respectively, and the TDs could be converted to 22.1 Gy (13.9 to 31.5 Gy) and 22.8 Gy (18.3 to 29.3 Gy) with 3 fractions using linear-quadratic model with α/β of 3, respectively. Although we investigated the TDs for only six cases, the TD in this study was evaluated to be similar the TDs from the other studies.
The variation of the intensity change according to follow-up time was evaluated for patient #3, as shown in Fig. 4. The difference in the intensity between the pretreatment and follow-up MRI was decreased, and the TD was increased according to increasing follow-up time. The reduction of the intensity change may imply that hepatocyte function in the liver parenchyma could be repaired over time in considering pathway of the Gd-EOB-DTPA's uptake. We observed that the signal intensity of the liver parenchyma within the regions exposed to high dose was repaired heterogeneously, as shown in Fig. 4C–F. These heterogeneous repair of the signal intensity may decrease the concordance according to the length of follow-up time. Herfarth et al. [15] reported a linear correlation between the TD and time, and Seidensticker et al. [22] also reported increases in TD according to longer follow-up. Seidensticker et al. [22] reported a reduction in FLR volume due to repair of the liver parenchyma. In addition, it was observed that craniocaudal directional signal intensity in FLR region might be repaired more rapidly over follow-up as shown in Fig. 4. It seems that uncertainty of respiration may blur dose distribution in the direction. However, the change in intensity of normal liver receiving over 56 Gy was not varied despite longer follow-up. It seems that repair of signal intensity is strictly correlated to the radiation dose distribution, and the TD for developing irreversible loss of Gd-EOB-DTPA's uptake by hepatocytes may be 56 Gy for these cases.
In conclusion, our method calculates the relationship between dose and the change in intensity in follow-up Gd-EOB-DTPA-enhanced MRI hepatobiliary phase images and helps determine individual TDs for developing FLR automatically. Although the sample size was small, the method was shown to be a useful tool for evaluating individual TDs and the relationship between dose and change in signal intensity. This method can also provide better information about radiation-induced hepatic injury in radiotherapy for liver cancer.