


Introduction
The fibrates are ligands for peroxisome proliferator-activated receptor ╬▒ (PPAR╬▒) and some of them are used clinically as hypolipidemic drugs to reduce blood triglyceride and cholesterol [1-4]. All PPARs belong to the nuclear hormonal receptor superfamily and forms a heterodimer with retinoid X receptor (RXR), another nuclear hormonal receptor [5]. The dimers interact with peroxisome proliferator response element (PPRE) and activate transcription of the target genes [6]. PPARs contain the functional domains including DNA binding domain (DBD) and ligand binding domain (LBD). PPAR/RXR heterodimers bind to a PPRE located in the promoter of target genes through the DBD. Natural and synthetic ligands bind to the LBD, either activating or repressing the receptor [5]. So far, three isoforms of PPAR, i.e., ╬▒, ╬▓/╬┤, and ╬│, have been reported [7]. Although PPARs share extensive structural homology, each isoform differs in their cell and tissue distribution as well as in their target genes. PPAR╬▒ is distributed mainly in the metabolically active tissues, like liver, kidney and heart. The major action of PPAR╬▒ is the regulation of fatty acid metabolism [8,9]. Another action of PPAR╬▒ is the upregulation of peroxisomes. The fibrates and 4-chloro-6-(2,3-xylidine)-2-pyrimidinylthioacetic acid (Wy-14643), one of PPAR╬▒ ligands, are known to cause peroxisome proliferation and hepatomegaly in rodents [6]. Recently PPAR╬▒ has been demonstrated to be an activator of anti-oxidative enzymes, such as catalase and superoxide dismutase (SOD) and anti-inflammatory mediators [10-17].
Radiation effects may occur as direct ionizations in an organic molecule or indirectly via free radical processes. In the indirect action, which is dominant in treatment with x-rays and ╬│-rays commonly used in clinical radiotherapy, radiation interacts with cellular molecules (mainly water) to produce free radicals, such as hydroxyl radicals (ŌĆóOH) and aqueous electrons (e-aq). The radiation-induced reactive oxygen species (ROS) will undergo further reactions. The aqueous electron reacts with oxygen to produce the superoxide anion radicals (O2ŌĆó-). The spontaneous or SOD-catalyzed dismutation of superoxide generates hydrogen peroxide (H2O2), which yields the highly toxic hydroxyl radicals through a Fenton reaction or a Haber-Weiss reaction [18]. Most of the x-ray and ╬│-ray damage is caused by free radicals which not only kill tumor cells by inducing mitotic failure or apoptotic death, but also give harm to the surrounding normal cells.
The antioxidant actions of the fibrates may modify radiation sensitivity. If the patients taking the fibrates undergo radiation therapy the results may be changed. However, there is no report on this issue. Here, we investigated the change of the radiation sensitivity in cervix cancer cells combined with fenofibrate (FF), which is commonly used to reduce triglyceride.
Materials and Methods
1. Cells and culture conditions
The two cervix cancer cell lines (HeLa, Me180) were purchased from the Korean Cell Line Bank (Seoul, Korea). The cells were grown in Dulbecco's modified Eagle's medium (DMEM) containing 10% fetal bovine serum supplemented with 100 IU/mL penicillin, 100 ┬Ąg/mL streptomycin. The cells were kept in a humidified atmosphere containing 5% CO2 at 37Ōäā. FF was purchased from Sigma-Aldrich Co. (St. Louis, MO, USA) and dissolved in dimethyl sulfoxide (DMSO) at a final concentration of less than 0.1% DMSO in the culture medium. All standard culture reagents were from Invitrogen (Carlsbad, CA, USA).
2. Protein extraction for Western blot and catalase activity assay
Cell proteins was obtained by rinsing the cells with phosphate-buffered saline (PBS) pH 7.2 three times, scraping the cells from the culture flasks with a rubber policeman, and centrifuging at 1,000 rpm for 10 minutes. The cells were washed with PBS two times and pellets were kept frozen at -80Ōäā until used. At the time of analysis, the cell pellets were resuspended in one volume of 50 mM potassium phosphate buffer (pH 7.85) and sonicated on ice 3 times for 10 seconds using a Vibra cell sonicator (Branson 1510R-DTH; Branson, Danbury, CT, USA). Protein concentration was determined using the Bradford method using bovine serum albumin as a standard [19].
3. Superoxide dismutase activity assay
Superoxide dismutase activity was assayed using an assay kit (Dojindo, Gaithersburg, MD, USA). Briefly, 1 ├Ś 104 cells were seeded in each well of 96-well micoplates and next day, treated with various concentration of FF for 48 hours. After adding a set of assay solutions as indicated in the manufacturer's protocol the absorbance at 450 nm was measured using a microplate reader and SOD activity were calculated.
4. Catalase activity assay
Catalase activity was quantitated spectrophotometrically following the decomposition of H2O2 at 240 nm [20].
5. Western blot analysis
Proteins was denatured in 1 volume of sample buffer containing 62.5 mM Tris-HCl (pH 6.8), 10% glycerol, 2% sodium dodecyl sulfate (SDS), 5% ╬▓-mercaptoethanol (v/v) and 2-3 drops of saturated bromophenol blue solution at 100Ōäā for 3 min. The proteins were separated in a 12.5% denaturing polyacrylamide gel by electrophoresis and then transferred onto nitrocellulose membranes at 100 V for 1 hour at 4Ōäā The blots were then blocked in 4% dry milk in TTBS (0.02 M Tris buffer [pH 7.0] and 0.5% Tween 20) at room temperature for 2 hours and incubated with primary antibody (1:1,000) in TTBS at 4Ōäā overnight. After washing three times with TTBS, 5 minutes each, the blots were incubated with secondary antibody (1:10,000). After washing three times, the blots were visualized using chemiluminescence. The antibodies for CuZnSOD (SOD1), MnSOD (SOD2) and catalase were purchased from AbFrontier (Seoul, Korea).
6. RNA isolation and quantitative real-time polymerase chain reaction
RNA was isolated from the cells using TRIzol reagent according to the manufacturer's protocol (Invitrogen). cDNA was synthesized using iScript reverse transcriptase reagent (Bio-Rad, Hercules, CA, USA) from 1 ┬Ąg of RNA. The following primers were used for the real-time quantitative reversetranscription polymerase chain reaction (RT-PCR) with SOD1 (forward, 5'-CTCTCAGGAGACCATTGCATCAT-3'; reverse, 5'-CCAATTACACCACAAGCCAAACG-3'), SOD2 (forward 5'-TCAATAAGGAACGGGGACAC-3'; reverse 5'-GTAGTAAGCGTGCTCCCACAC-3'), and PPAR╬▒ (forward 5'-GGCGAATATGCTCAATGGT-3'; reverse 5'-GGCCACGAATTTTGAGGTTA-3'). The RT-PCR was performed with 20 ┬ĄL of reaction solution containing diluted cDNA, 20 pmol of each primer, and 10 ┬ĄL of two-step SYBR Green PCR Master Mix (Invitrogen). The thermal cycling parameters were 95Ōäā for 10 minutes for Taq polymerase activation followed by 40 cycles of 95Ōäā for 15 seconds and 60Ōäā for 1 minute. The reactions were performed in triplicate in each experiment. The threshold number of cycles (Ct) was recorded from each sample for both the target gene and the reference gene (GAPDH). Melting curve analysis was performed for each run. The relative expression of the target gene was calculated as ╬ö╬öCt, determined by subtracting ╬öCt of the reference gene from ╬öCt of the target gene. Each experiment was performed independently three times.
7. ROS measurement
Intracellular production of ROS was measured using the fluorescent dye, 2',7'-dichlorodihydrofluorescein-diacetate (H2DCFDA; Sigma, St. Louis, MO, USA) as described by Wan et al. [21]. Two days prior to experiments, cells were plated on 60 mm dishes. After drug treatment the cells were rinsed with PBS (no phenol red, Ca2+, or Mg2+) and incubated with 10 ┬ĄM of H2DCFDA at 37Ōäā for 10 minutes, and then irradiated using a linear accelerator (Mevatron; Siemens, Concord, CA, USA) at room temperature. The cells were detached with 0.25% trypsin and 0.11% ethylenediaminetetraacetic acid (EDTA), washed and resuspended in cold PBS and placed on ice, and analyzed using a FACScan flow cytometer (FACS Calibur-S; 488 nm excitation, 530 nm emission; Becton Dickinson, San Jose, CA). The mean geometric fluorescence intensity for 30,000 cells was analyzed for each sample using CellQuest Pro (BD Biosciences, San Jose, CA, USA).
8. Clonogenic assay
After treated with FF for defined duration the cells were irradiated. Irradiation was done using a linear accelerator (Mevatron; Siemens) with a dose rate of 3 Gy/min at room temperature. The cells were trypsinized and varying number of cells for optimal colony counting was seeded in 60 mm dishes. After 6-7 days the cells were stained with 0.1% crystal violet solution and the number of colonies, composed of at least 50 cells, was counted. Surviving fraction (SF) was calculated as follows: SF = plating efficiency (PE) of treated cells / PE of control cells. PE (%) was obtained from (colonies counted / cells plated) ├Ś 100. Cell survival curves were plotted by using linear regression model.
Results
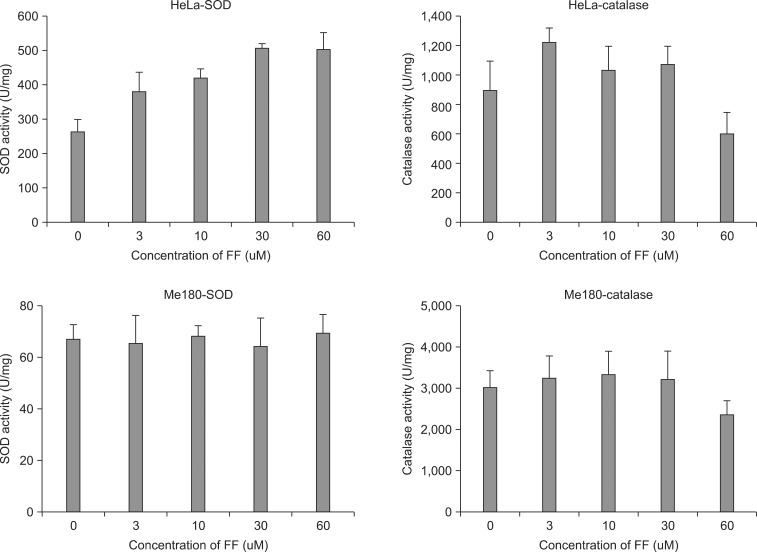
1. Effect of FF on total SOD and catalase activity
Total SOD and catalase activity was measured in the cells treated with 0, 3, 10, 30, 60 ┬ĄM of FF for 48 hours. Total SOD activity was increased with increasing FF doses and it was maximal at 30 ┬ĄM of FF: about two times higher than control in HeLa cells (Fig. 1). However, SOD activity was not increased with FF treatment in Me180 cells (Fig. 1). The catalase activity was increased about 40% at 3 ┬ĄM of FF in HeLa cells, but it was not increased at all dose ranges tested in Me180 cells (Fig. 1).
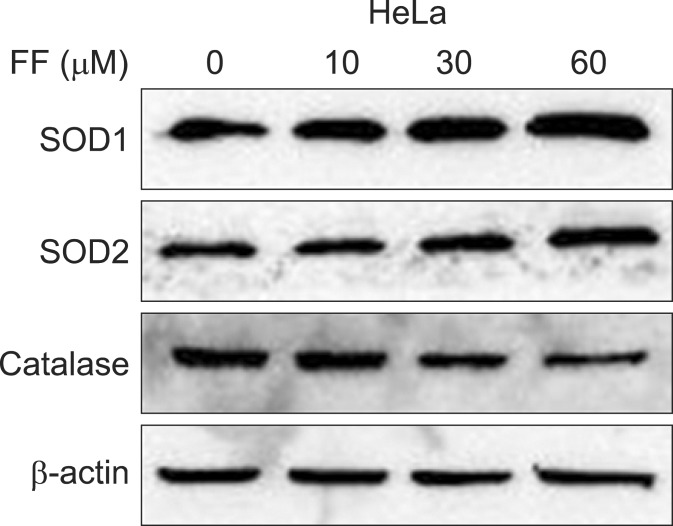
2. Effect of FF on SODs and catalase protein induction
To investigate whether the SOD and catalase activity is related with their protein expression, Western blot was done for SOD1, SOD2 and catalase in HeLa cells treated with various doses of FF for 48 hours. As with the activity the protein expression of SOD1 and SOD2 were increased with increasing doses of FF (up to 60 ┬ĄM) and that of catalase was decreased with increasing doses (30 and 60 ┬ĄM) of FF (Fig. 2).
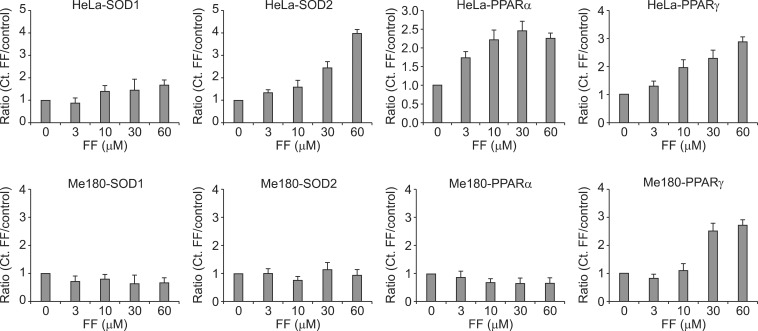
3. Effect of FF on SOD mRNA expression
To investigate whether protein expression of SOD1 and SOD2 is related with their mRNA expression, cells were treated with varying doses of FF for 48 hours and real time RT-PCR was done. Both mRNA of SOD1 and SOD2 were increased with increasing doses of FF in HeLa cells, but they were not increased in Me180 cells (Fig. 3). This suggests increased protein expression of SOD1 and SOD2 by FF are caused from increased expression of their mRNA.
4. Effect of FF on PPAR╬▒ and PPAR╬│ mRNA expression
To investigate whether protein expression of SOD1 and SOD2 is related with PPAR╬▒ and PPAR╬│ mRNA expression, cells were treated with varying doses of FF for 48 hours and real time RT-PCR was done. PPAR╬│ mRNA was increased with increasing doses of FF in both cell lines. However, PPAR╬▒ mRNA was increased with increasing doses of FF in only HeLa cells (Fig. 3). This suggests increased protein expression of SOD1 and SOD2 by FF are related with PPAR╬▒ mRNA expression.
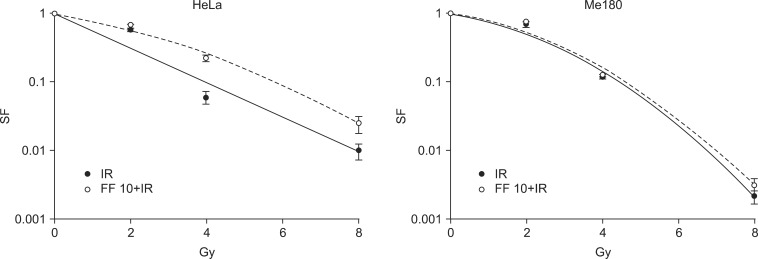
5. FF decreases radiation-induced cell death of HeLa cells
Next, we were interested in whether FF affects on radiation sensitivity. Cells were treated with 10 ┬ĄM of FF for 48 hours and irradiated. The survival curves showed radioprotective effect of FF in HeLa cells. However, such an effect was not observed in Me180 cells (Fig. 4).
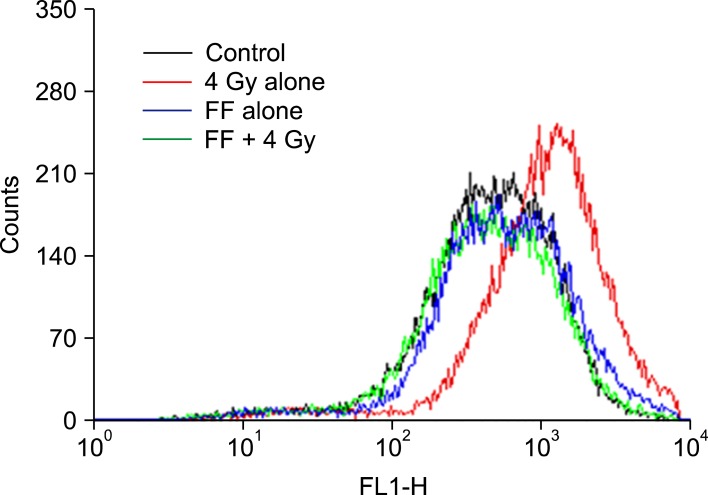
6. Intrinsic ROS and ROS produced by irradiation are effectively scavenged in the FF-pretreated HeLa cells
Finally, we were interested in whether FF modifies radiation sensitivity by scavenging ROS. To investigate whether SOD induced by FF contributes to scavenge ROS, HeLa cells were treated with 10 ┬ĄM of FF for 48 hours and irradiated with 4 Gy. ROS produced by 4 Gy was decreased in the cells treated with FF (Fig. 5).
Discussion and Conclusion
Peroxisomes are found in virtually all eukaryotic cells. A major function of the peroxisome is the breakdown of fatty acid molecules, in a process called ╬▓-oxidation. Peroxisomes contain oxidative enzymes for certain oxidative reactions, like the ╬▓-oxidation of fatty acids. The ╬▓-oxidation of fatty acids are the main processes that generate ROS in peroxisomes, in particular H2O2. In several animal species, activators of PPAR╬▒, like fibrates increase the number and volume of peroxisomes and this peroxisomal proliferation increases the expression of peroxisomal oxidases that produce H2O2, such as acyl-CoA oxidase (ACO) [22]. Together with increased levels of H2O2 generation by peroxisomal enzymes, the reduced activities of antioxidant enzymes, such as catalase, SOD, and glutathione peroxidase (GPx) could induce oxidative stress in liver of rats treated with peroxisome proliferators [23,24]. However, peroxisomes or other cell compartments can also respond to oxidative stress and ROS. Among the enzymes in peroxisomes that degrade ROS, catalase and GPx decompose H2O2 produced by several peroxisomal oxidases and superoxide anions generated by peroxisomal xanthine oxidase are scavenged by MnSOD and CuZnSOD [22]. The PPRE, the binding site for PPAR, has been recently identified in the promoter area for the catalase and SOD genes, and therefore, catalase and SOD have been identified as the target enzymes of PPAR╬▒ [25,26]. Previous studies have demonstrated that peroxisome proliferators like fibrates led to increases in the activity of peroxisomal oxidases, with a concomitant increase in antioxidant enzymes, in mainly catalase [10-16]. Among the synthetic peroxisome proliferators, the largest group consists of the amphipathic carboxylates, such as Wy-14643, benzafibrate, ciprofibrate, fenofibrate, and clofibric acid. These compounds have been shown to decrease hepatic lipid peroxidation or fibrosis in rats and mice liver by upregulating the expression of antioxidant enzymes, such as catalase, SOD, or ubiquinols [13-16]. In addition to fibrates, oxidative stress generated by UV irradiation or H2O2 has been shown to induce peroxisomal proliferation in human hepatoblastoma cell line [27]. Also, in purified peroxisomes from rat liver, the increased activity of SOD and GPx has been reported after induction of oxidative stress by endotoxin treatment [28]. A PPAR╬▒ ligand, Wy-14643, was also recently found to protect hippocampal neurons from oxidative damage induced by Abeta peptide and was reported that these events are mediated by the increase in the number of peroxisomes and in catalase activity [11]. Taken together, these studies suggest that the peroxisomes proliferation and the activation of ROS-producing oxidative enzymes in peroxisomes by fibrates might induce the activation of antioxidant enzymes responding to such oxidative stress in peroxisomes or other cell compartments. In this study, we also observed that the maximum SOD activity was about two times higher in FF-treated HeLa cells as compared to control, with a little bit increased catalase activity up to 10 ┬ĄM dose. This increased SOD activity was also correlated with increases in the expression of SOD proteins with increasing doses of FF. We have also confirmed, by using the quantitative RT-PCR method, that these increased expressions of SOD protein are caused from their mRNA transcriptions. In a previous study, the selective increase of the CuZnSOD activity in purified rat liver peroxisomes, as compared with mitochondria and cytosol has been reported after treatment with ciprofibrate, peroxisome proliferators [12].
More importantly, the increased activities of antioxidants, including the SODs, in cancer cells and tissues might reduce the cytotoxic effects of ROS-generating chemotherapy drugs and radiation, although the final effect may also depend on several factors, such as cell type, environmental factors, and the balance of antioxidant enzymes in the cell. However, the published studies about the relation of SODs to radiation sensitivity show some conflicting results depending on the increased levels of SOD activities. In the MnSOD-transfected HeLa cervical carcinoma cells, MnSOD overexpression protected the cells from growth suppression by serum deprivation, which is associated with increase in ROS generation [29]. In nonmalignant Chinese hamster ovary (CHO) cells, MnSOD expressing clone, which is with about 4-fold higher enzyme activity than its parental cells, was more resistant to irradiation than CuZnSOD and GPx expressing clones [30]. By contrast, MnSOD-transfected A172R human glioma cells with more than 5-fold increased activity of MnSOD and high SOD E. coli clone with more than a 10-fold increase in SOD activity became more sensitive to radiation [31,32]. These studies suggest that the increased activity of SOD may cause increased resistance to radiation and ROS, but the high SOD activity of more than 5-fold compared with parental cells may lead to increased sensitivity in conditions without changes in other antioxidant enzymes, such as catalase and GPx, due to overproduction of toxic H2O2 or ŌĆóOH by SOD. Although oxidative stress can be quantified indirectly by measuring the products of oxidative damage, such as lipid peroxides and DNA adducts, the dichlorofluorescein (DCF) assay is a more direct and sensitive method to measure oxidative stress. In our results, the modest increased SOD activity of less than 2-fold by FF treatment contributed to decrease the level of 2,7-dichlorodihydrofluorescein (DCFH) oxidation, through scavenging intrinsic ROS in HeLa cells and ROS produced by 4 Gy irradiation. Therefore, this increase of ROS scavenging in FF pretreatment group resulted in the decrease of radiation sensitivity in clonogenic assay.
There is an intense argument on the concurrent use of antioxidants with chemotherapy and/or radiotherapy. Although considerable existing data support that dietary antioxidants do not interfere with these therapeutic modalities for cancer [33], many oncologists take the position that antioxidants by their nature undermine the free radical mechanism of chemotherapy and radiotherapy and should therefore generally be avoided during treatment. In conclusion, our study demonstrated that the increased SOD activity by FF, which is currently used in therapy of hyperlipidemia, decreases the radiation sensitivity in HeLa cells. Based on our findings, we speculate that the cytotoxic effect of radiation might be reduced in the patients taking the fibrates during radiotherapy. Therefore, some caution could be needed to clinicians and patients in this condition. Additional in vivo studies on radiation sensitivity modification by FF and clinical evaluations for radiotherapy response in the patients taking the fibrates during radiotherapy are needed in the future to reconfirm our findings.