


Introduction
Computed tomography (CT)-based treatment planning before radiation therapy (RT) has become standard practice. CT simulation and three-dimensional treatment planning for RT offer more accurate targeting, improved dose homogeneity and avoidance of critical organs. Some investigators have also reported that the CT simulation images used in RT could be used to detect unexpected abnormalities [1,2,3,4].
In general, incidental findings detected on CT simulation images are rare [3]. However, lung metastases from hepatocellular carcinoma (HCC) are not infrequent and are sometimes detected on CT simulation images before their definitive diagnosis. Therefore, it is necessary for radiation oncologists to review CT simulation images carefully.
Image review was performed by a diagnostic radiologist in most of the previous studies. However, in a real clinical situation, CT simulation images are not routinely interpreted by a radiologist because of heavy workloads. With advances in digital imaging technologies, approaches to automated computer diagnosis to aid in the decision making process of the radiologist have emerged. Computer-aided diagnosis (CAD) was developed for computerized analysis of medical images in the 1960s [5]. CAD systems rely on a discrimination mechanism based on densitometric gray-level thresholding and recognize nodules as opaque lesions surrounded by lung parenchymal attenuation [6]. In diagnostic radiology, CAD is used to improve the diagnostic accuracy of medical images and the performance of the radiologist.
The purpose of this study was to investigate the clinical significance of undetected incidental lung nodules found on CT simulation images assisted by CAD in HCC patients, thereby assessing the feasibility of using CAD to review CT simulation images in the clinical setting of a radiation oncology practice.
Materials and Methods
1. Eligibility
Treatment-naïve HCC patients treated with scheduled interval transcatheter arterial chemoembolization (TACE) and RT between March 2008 and December 2010 were reviewed retrospectively. The eligibility criteria included unresectable HCC, clinical liver function with a Child-Pugh score of A or B, and no previous history of treatment for any other malignancy. Patients who had an Eastern Cooperative Oncology Group performance status of more than 2 or an extrahepatic metastasis at diagnosis were excluded.
2. Treatment and follow-up protocol
All patients were initially treated by TACE. On day 8 after TACE, all patients underwent pre-RT clinical examinations which included a physical examination and biochemical profiles including a liver function test. If the results of the pre-RT clinical examinations indicated that the patient was fit to undergo RT, CT simulation was performed on the same day. RT was initiated on day 14 after TACE. Regular follow-up liver CTs were done after RT. The first follow-up liver CT was performed after 1 month and thereafter at 3- to 4-month intervals.
3. Computed tomography simulation and computer-aided diagnosis
CT simulation was performed with a LightSpeed RT16 (GE Healthcare, Milwaukee, WI, USA) helical scanner set at 120 kVp, auto mA and 5-mm slice thickness. Intravenous contrast media (Visipaque 270, Amersham Health Inc., UK; 2 mL/kg to a maximum of 200 mL) was delivered at a rate of 5 mL/sec, and exhale breath-hold CT scans were obtained at 25 to 30 seconds intervals (arterial phase) and 50 to 60 seconds (portal phase) after the injection. Following this, 4-dimensional CT scans were acquired by a retrospective binning method using a Real-time Position Management (RPM) system (Varian Medical System, Palo Alto, CA, USA). The CT simulation utilized a scan range from 5 cm above the diaphragm to 5 cm below the liver.
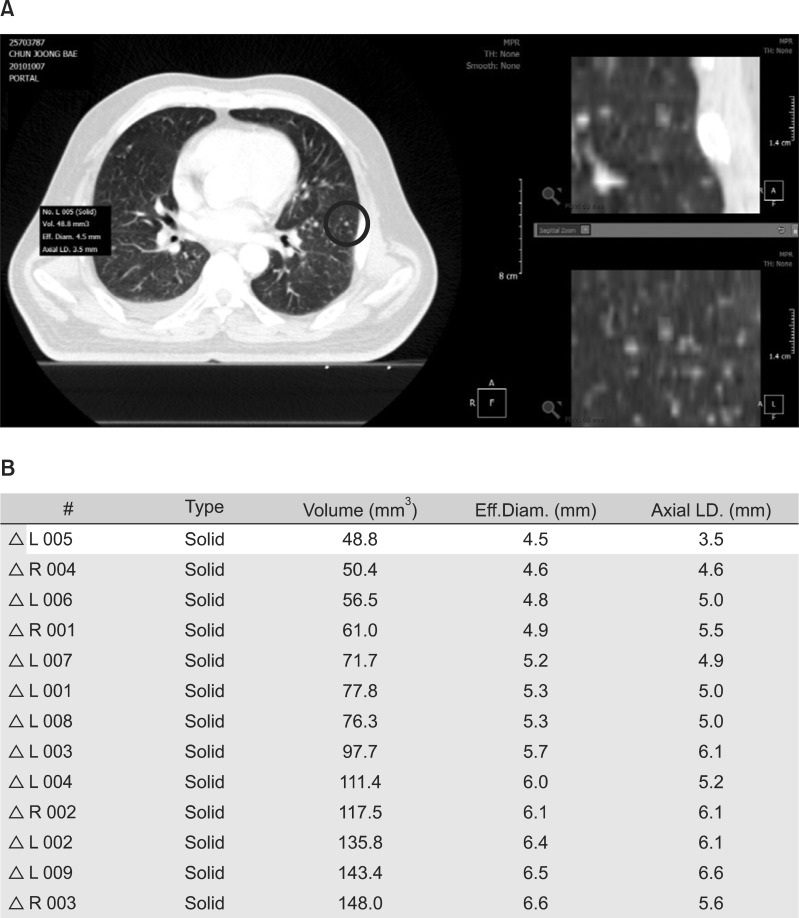
The portal phase image data in Digital Imaging and Communications in Medicine (DICOM) format were digitally transferred from the CT scanner to a personal computer for image analysis. For automated lung nodule detection, a commercially available CAD system (Xelis-Lung Solution; INFINITT Healthcare Corp., Phillipsburg, NJ, USA) was used. This provided automatic 3-dimensional nodule volume measurements in the lung region and other key statistics useful in nodule classification (Fig. 1).
4. Review of the computed tomography simulation images
All CT simulation images were analyzed using CAD for automated nodule detection. Following this analysis, a radiation oncologist reviewed the CT simulation images without the assistance of CAD. And the nodules detected by CAD were categorized by a physician. The final results of CT simulation image review were assembled through the integration of the results from the image reviews performed using CAD and by a physician.
The diagnosis of a lung metastasis was based on the increment of nodule size and the morphological characteristics of the nodule. Typical radiologic findings of a lung metastasis include multiple peripherally located round variable-sized nodules and diffuse thickening of the interstitium [7,8]. To focus on the detection of synchronous lung metastases, only CT images obtained within 4 months after RT completion were used for diagnosis of lung metastasis.
5. Statistical analysis
To assess the performance of CAD and a physician in the detection of metastatic lung nodules, the sensitivity, false positive (FP) fraction, negative predictive value (NPV) and positive predictive value (PPV) were used.
Before calculations were performed, we defined the following terminologies: 1) true positive (TP) was defined as the significant nodule diagnosed as metastatic; 2) FP was defined as the significant nodule diagnosed as non-metastatic; 3) false negative (FN) was defined as the nodule considered insignificant diagnosed as metastatic; and 4) true negative (TN) was defined as the insignificant nodule eventually diagnosed as non-metastatic. Additionally, the patients who developed lung metastasis without initially detected lung nodule defined as FN. The patient with no detected nodule who eventually revealed to be non-metastatic defined as TN. Only CT images obtained within 4 months after RT completion were used for diagnosis of lung metastasis.
The sensitivity, NPV, and PPV were calculated for the number of nodules or the number of patients.
Results
1. Patient characteristics
Patient characteristics are shown in Table 1. A total of 67 patients were analyzed. The median follow-up time for all patients was 10.1 months (range, 1 to 44.5 months). The median age of all patients was 55 years. Most of patients had vascular invasion (95.5%) and multiple primary lesions (65.7%).
2. Nodules detected by computer-aided diagnosis alone on computed tomography simulation images
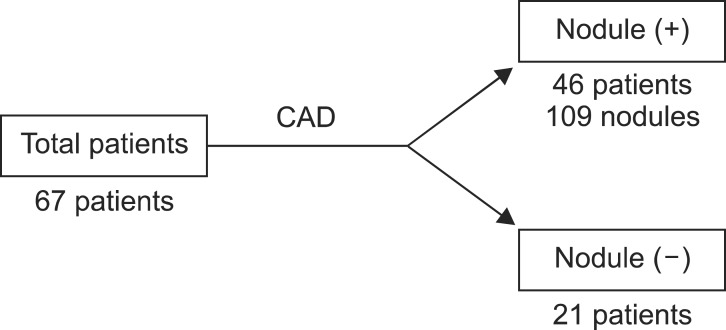
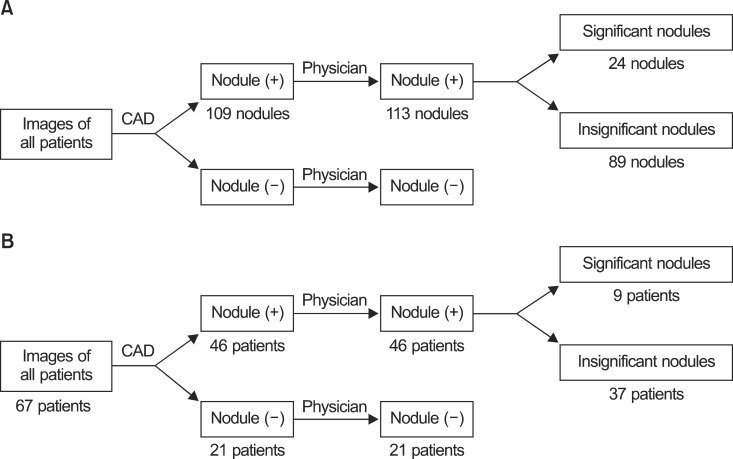
Total number of CT simulation image was 67. Forty-six patients had incidental nodules detected by CAD on CT simulation images (Fig. 2). The total number of detected nodules was 109. These nodules were divided into two categories (Fig. 3). First, a 'significant nodule' was defined as a real lung nodule surrounded by lung parenchyma. A lung nodule is defined as a round opacity at least moderately well-marginated and no greater than 3 cm in maximum diameter [9]. Second, an 'insignificant nodule' was defined as a false nodule (e.g., intersection of bronchial or vascular structures, peribronchial thickening, or false nodular structure surrounded by bowel gas below the diaphragm).
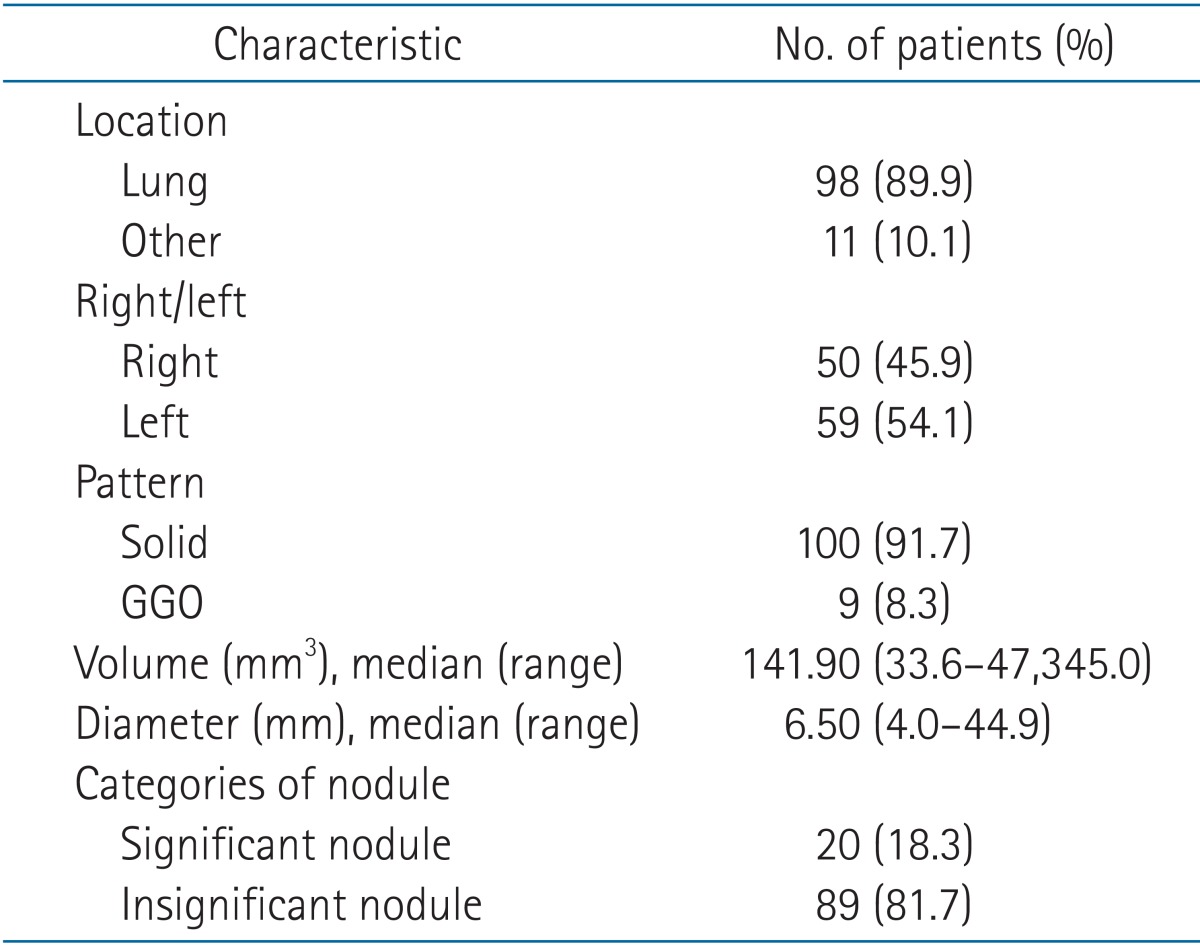
The characteristics of the 109 nodules detected by CAD are summarized in Table 2. Most of the nodules were located in the lung (89.9%), but 11 (10.1%) nodules were located outside the lung. Only 20 (18.3%) nodules were considered to be significant nodules. The remaining 89 (81.7%) nodules were considered to be insignificant nodules.
3. Nodules detected by integration of computer-aided diagnosis results and physician review on computed tomography simulation images
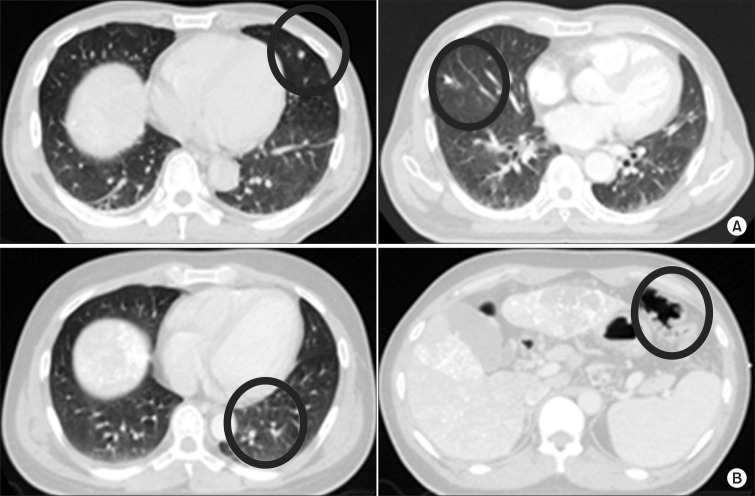
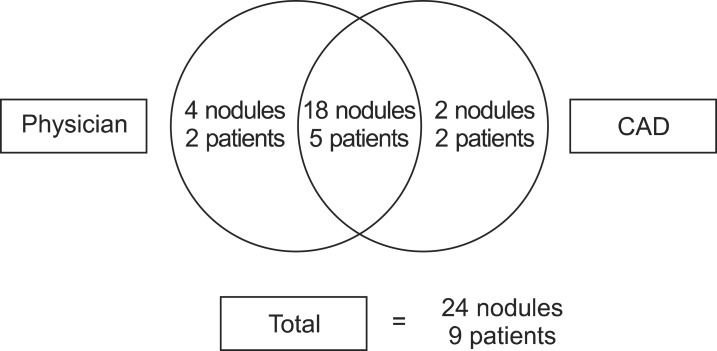
Twenty significant nodules in 7 patients were detected by CAD alone (Fig. 4). Among those 20 significant nodules, the physician failed to detect 2 significant nodules in 2 patients. These 2 nodules were located in regions of increased haziness due to insufficient inflation of the lung. However, the physician detected 4 additional significant nodules in 2 patients that were not detected by CAD. The locations of nodules missed by automated detection by CAD were in the subpleural area, or adjacent to the diaphragm or pericardium. As a result, the total number of significant nodules detected by both CAD and the physician was 24 in 9 patients.
A total of 109 nodules were detected by CAD alone and 4 additional nodules were found after the review by a physician (Fig. 5A). Among the total of 113 nodules, 24 were found to be significant nodules while 89 nodules were categorized as insignificant nodules. Fig. 5B illustrates the corresponding number of patients with or without nodules after the review of images by CAD and a physician. Forty-six patients had nodules detected by CAD alone. The same number of patients was found to have nodules after review by both CAD and a physician. Among those patients, 9 patients had the significant nodules and 37 patients had insignificant nodules.
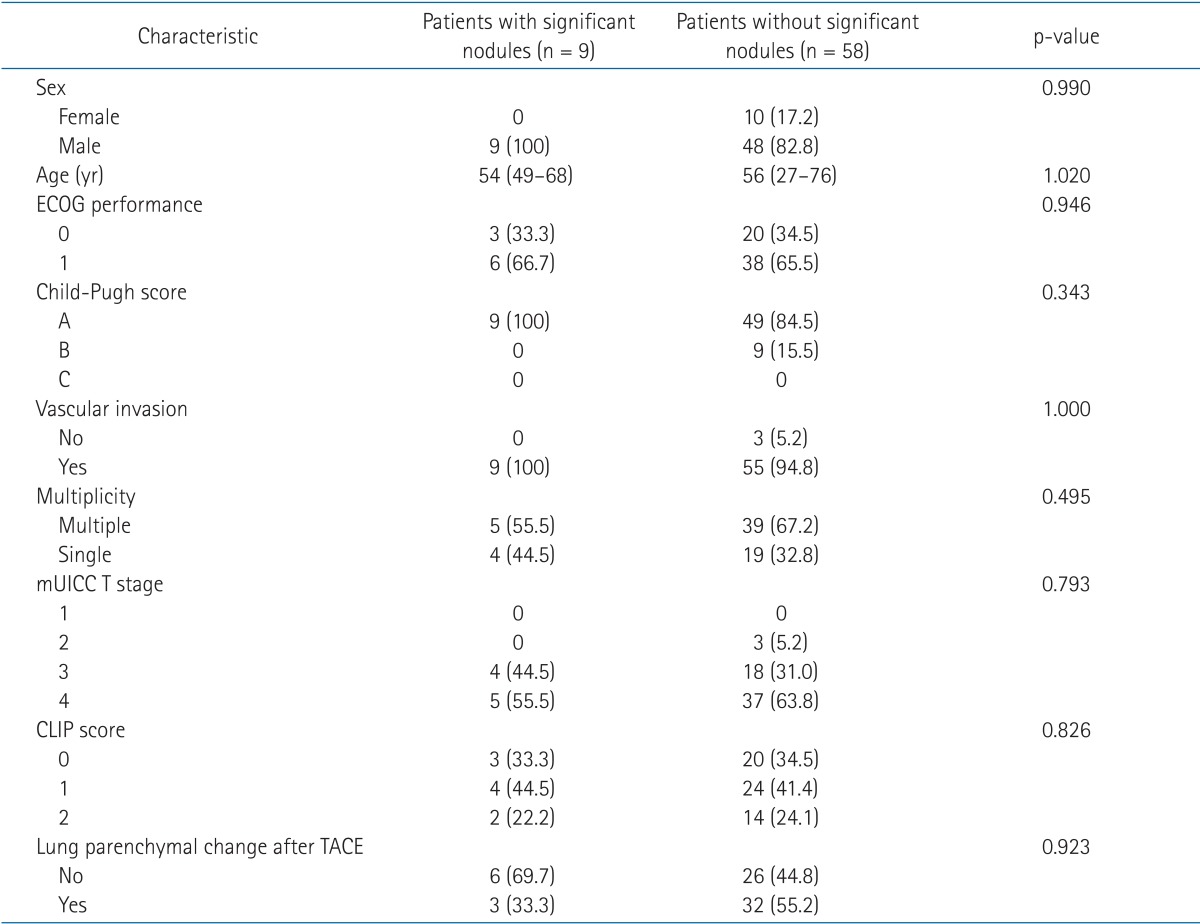
The differences between the patients with significant lung nodules and the remainder of the patients are summarized in Table 3. There were no significant differences between the two groups.
4. The fate of the incidental lung nodules on computed tomography simulation images
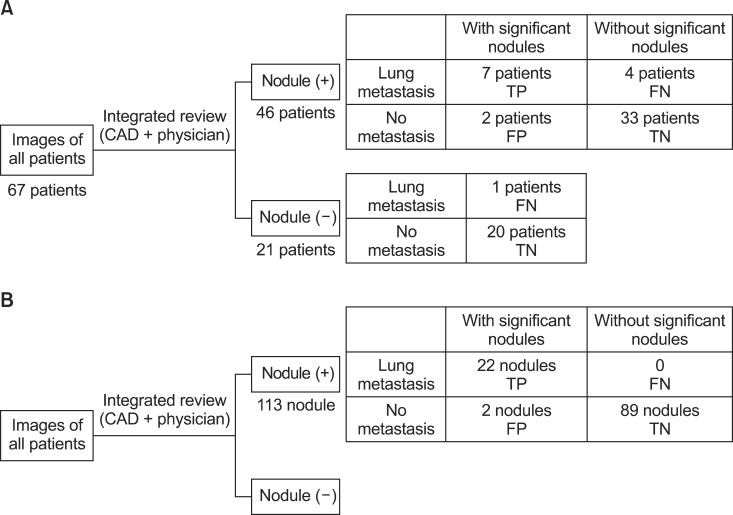
During follow-up, lung metastasis was found in 12 patients. The median time to synchronous lung metastases was 1.1 months (range, 0.9 to 3.8 months). The correlation between the development of a lung metastasis and the review results of the CT simulation images by CAD and a physician is presented in Fig. 6. Lung metastasis developed in 11 of 46 patients with any type of nodule (Fig. 6A). Among 9 patients with significant nodules, 7 patients developed a lung metastasis. In patients without significant nodules, 4 patients developed a lung metastasis. Only one patient among those patients without nodules developed a lung metastasis.
The number of nodules diagnosed as metastatic lung nodules was 22 among the 113 nodules detected after the review of CT simulation images (Fig. 6B). Among the 24 significant nodules, 22 nodules were eventually diagnosed as metastatic lung nodules. None of the 89 insignificant nodules became a metastatic nodule.
The corresponding bins of TP, FP, TN, and FN are diagrammed in Fig. 6. The sensitivity was 58.3% calculated based on patient number. When calculated based on the number of nodules, sensitivity was 100%. The NPVs were 91.4% and 100% based on patient number and on the number of nodules, respectively. PPVs of 77.8% and 91.7% were calculated based on patient number and number of nodules, respectively.
Discussion and Conclusion
HCC is a leading cause of cancer death with a high incidence in Asian countries. Although prognosis has improved as a result of advances in diagnostic techniques and treatment modalities, it still remains poor, with a mean survival of 6-20 months [10]. Hepatic resection offers the best chance for a possible cure, but less than 20% of patients are eligible for resection at the time of diagnosis. Treatment options for unresectable HCC are TACE, RT alone or combination therapy including TACE or sorafenib [11,12,13,14]. For advanced HCC with distant metastases, coexisting extrahepatic lesions are usually not treated by loco-regional therapies. In randomized controlled trials, the multikinase inhibitor sorafenib resulted in prolonged survival and is consequently considered a standard treatment for such patients [15].
The most frequent site of extrahepatic metastasis is the lung and the median survival for patients with lung metastasis is about 8 months [16]. Due to the high incidence of extrahepatic metastases which occur in up to 40% of HCC cases, chest imaging is recommended as a part of the initial workup. CT is currently the best imaging modality for evaluating lung nodules because of its spatial and contrast resolution. If chest X-ray is the only available chest imaging method, CT simulation for RT could be the first imaging modality used for more precise lung evaluation, despite the fact that the whole lung is not scanned. The incidental finding of metastatic nodules was not an uncommon event. Twenty-two of 113 (19.5%) nodules and 22 of 24 (91.7%) significant nodules (detected by CAD and a physician) were metastatic nodules in our study. To avoid unnecessary treatment, a radiation oncologist should review the CT simulation images carefully to detect unexpected incidental findings, such as a lung metastasis. Also, re-evaluation of treatment modalities is needed if a significant nodule is found on image review due to the high likelihood of lung metastases.
Some studies have recommended routine interpretation of simulation images by diagnostic radiologists [3]. This recommendation can be difficult to follow depending on the clinical situation. Also, lung nodules present on a chest CT, especially those smaller than 5 mm, can be easily missed by the physician when using only a visual assessment. Numerous studies have shown that CAD has allowed a significant increase in diagnostic accuracy and an improvement in the performance of physician in detecting lung nodules [6]. These benefits are particularly evident with inexperienced physicians [17]. In a large observer study by Brown et al. [18], the use of a CAD system for nodule detection resulted in a 12%-23% increase in detection rate and equalized the detection rate between radiologists and non-radiologists. Similarly, in our study, use of CAD resulted in the detection of 2 additional significant nodules which were undetected by the physician during visual inspection.
The computer output is generally used by physicians as a second opinion in order to improve upon the sensitivity of a human reader. In the study by Beyer et al. [19], the reading time was 274 seconds when CAD was used to preselect lung nodules prior to reading by a physician. Although the reading time was longer when CAD was used as a second reader to check out overlooked nodules after reading by a physician, the sensitivity was significantly higher. Due to the multiplicative benefits of utilizing CAD as a concurrent reader, use of CAD has become widespread in clinical situations. However, CAD had high FP rate. Furthermore, nodules not surrounded by lung parenchyma are likely to be missed, especially in subpleural, fissural, and costophrenic angle areas [20,21]. Moreover, CAD analysis is a complex procedure.
There are some considerations in interpreting our results. First, the slice thickness of the CT simulation image was thicker than those used in previous studies. A correlation between section thickness and sensitivity of CAD has been previously reported by Kim et al. [22]. The sensitivity was 95.2% for the 1-mm slice thickness group and 88.5% for the 5-mm slice thickness group, respectively. Second, our CT simulation images did not cover the whole lung and included the abdominal cavity with loculation of bowel gas in the scanning range. Various segmented vascular structures might lead to misinterpretation of CAD [21]. Also images of other organs might contribute to the high number of insignificant nodules detected. Third, the detection rate by physicians in our study may have been higher than those of a typical clinical practice. Study physicians may have reviewed the images more thoroughly than usual and may therefore have influenced the detection rate in the current study.
In order for wide usage of CAD systems to become standard practice, the diagnostic accuracy will need to be improved. Furthermore, in order to improve accessibility for radiation oncologists, the development of a CAD system which is combined with an RT planning system would be required.