


Introduction
Brain metastasis has been observed at an approximate incidence rate of 10%вҖ“30% [1,2]. The prevalence of brain metastasis among patients with intracranial tumors has been recorded at 19.9% in Thailand [3]. Lung, breast, and renal cell carcinomas, along with cutaneous melanoma, are extracranial forms of cancer that displayed a high propensity to be disseminated into the brain [4,5]. Radiotherapy (RT) has been determined to be the primary treatment modality used to eradicate intracranial dissemination. RT modalities include whole brain radiation therapy (WBRT) and stereotactic radiosurgery (SRS). WBRT technique delivers radiation to all parts of the brain while SRS can precisely provide radiation to the specific intracerebral mass. SRS and WBRT have been employed as adjuvant treatment options after surgery for solitary brain metastasis. These two techniques provide better local brain control when compared to surgery alone [6,7]. For patients who had one to four unresected brain disseminations (oligo-metastasis), WBRT and SRS produced comparable local tumor control. WBRT offered better distance brain control while resulting in more cognitive deterioration without survival enhancement when compared to SRS [8,9]. Therefore, SRS is a preferable radiation modality over WBRT in the treatment of oligo-metastatic intracranial lesions according to the most recent recommendations [10]. Numerous radiation machines can be used to facilitate the SRS technique through a specific arrangement of different radiation beams and multiple mechanical factors. Historically, Gamma-Knife and cone-based LINAC radiosurgery (Cone-based) techniques have been widely used as standard SRS modalities. Currently, emerging advanced technologies have allowed intensity-modulated radiation therapy (IMRT) to be operated with very steep radiation dose gradients. Thus, SRS by IMRT has become an extremely popular method of treatment. Various radiation devices are capable of delivering IMRT, including helical tomotherapy (HT) and volumetric modulated arc therapy (VMAT), which have been installed in our center. The HT (Hi-ART equipped dynamic jaws; TomoTherapy Inc., Madison, WI, USA) machine employ the ring-based linear accelerators. HT delivers fan-beam radiation simultaneously with continuous couch movement along the z-axis. The radiation beams are modulated via the binary multileaf collimator. Because of the unique characteristics of the ring-based machine, isocentric couch rotation cannot be employed, resulting in the sole administration of the coplanar treatment technique. For VMAT, this machine (Elekta Synergy, Stockholm, Sweden) serves as a c-arm based linear accelerator. Unlike HT, the VMAT machine delivers broad-beam radiation and allows for isocentric couch rotation (Вұ95В°). This has resulted in the successful use of both coplanar and non-coplanar treatment techniques. However, in this procedure, a couch is constantly positioned in each planned arc beam while the gantry and multileaf collimator (MLC) are continuously moved. The radiation beams are modulated by gantry speed, leaf speed and radiation dose rate. With regard to the Cone-based technique employed in our study, we applied the c-arm based VMAT machine to perform SRS (non-dedicated machine). The differences between VMAT and the Cone-based technique are associated with certain details involved in radiation planning; however, the radiation beams are not modulated in the Cone-based technique. The primary collimator is positioned at an exact size in our center, specifically 10 cm Г— 10 cm. The appropriate cylindrical collimator diameter is then employed to create a pencil-beam of radiation that covers each individual treatment field. Therefore, multiple isocenters or various isocentric couch rotations are typically applied in this modality, which distinguishes it from the single isocenter technique that is routinely employed in both HT and VMAT. This study aims to compare radiation dosimetry and the parameters of SRS through the use of three different modalities; HT, VMAT, and Cone-based LINAC radiosurgery.
Materials and Methods
1. Study design
This study included patients who fulfilled the following inclusion criteria: (1) known primary extracranial malignancy displaying clinical and diagnostic imaging compatible with brain metastasis, (2) MRI of the brain showing oligo-metastatic brain lesions, and (3) each intracranial tumor less than 3 cm in size and at least 5 mm from any critical structures (brainstem and optic apparatus). Patients who participated in this study were subjected to computed tomography simulation (CT SIM) by applying 1-mm slice thickness. An SRS-system mask (R406-1 SRS mask; Klarity, Guangzhou, China) was used for non-invasive immobilization (Fig. 1). Diagnostic MRI images taken within 1 week before simulation were registered into the CT SIM dataset to define targets and for delineation of the organs-at-risk (OARs). Target delineation was composed of gross tumor volume (GTV), which was delineated by contouring the contrast-enhancing lesions observed on T1 gadolinium-3D weighted MRI images. Subsequently, no margin was added to create the clinical target volume. The planning treatment volume (PTV) was defined by 2 mm isotropic expansion of the GTV. The prescription dose to each lesion was dependent upon tumor size with 20 Gy for lesions of less than 1 cm, 18 Gy for lesions of 1вҖ“2 cm, and 15 Gy for lesions of 2вҖ“3 cm. The OARs, including the whole brain, hippocampi, optic nerves, optic chiasm, pituitary gland, brainstem, both cochlea, bilateral globes, and the lens, were contoured. Radiation doses constrained to the target were established as follows: volume of whole brain receiving a dose of 12 Gy (V12) 5вҖ“10 mL, maximal dose (Dmax) to hippocampus, optic apparatus, brainstem and cochlea, and lens receiving doses of 7 Gy, 8 Gy, 10 Gy, and 2 Gy, respectively. The mean dose (Dmean) to the pituitary gland was constrained at 15 Gy.
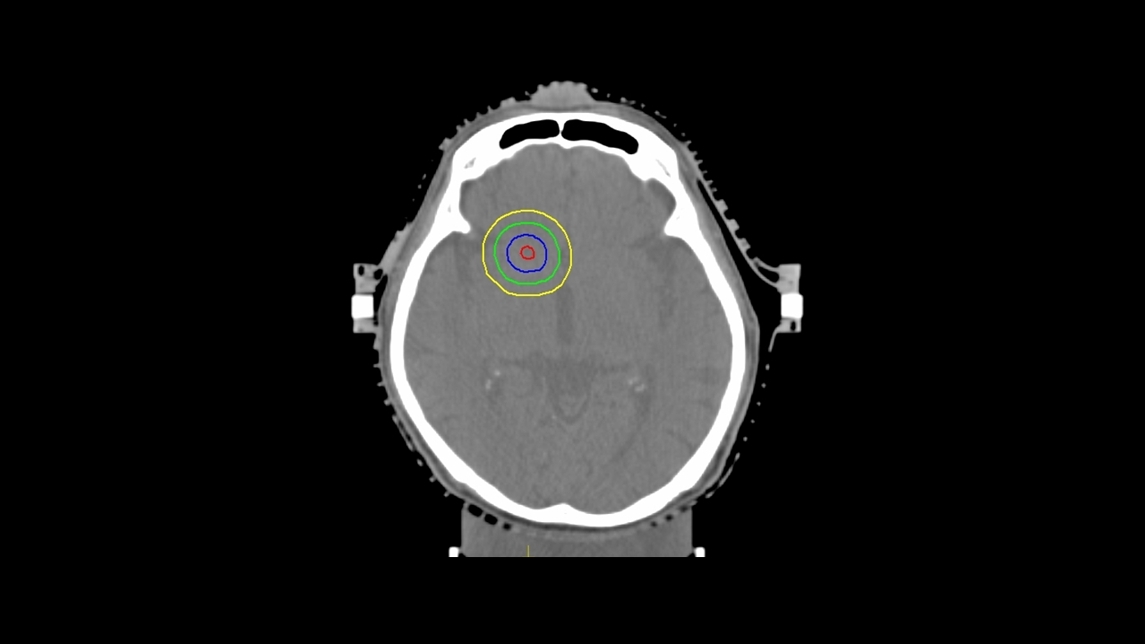
Virtual structures and help organs were created following the guidelines outlined by Soisson et al. [11]. Help structures were created for tomotherapy and VMAT which involved inverse planning, whereas the cylindrical collimator did not. The clinical sub-volume (CSV) was created at the centroid of the GTV with a diameter of 2 mm (Fig. 2). To create a steep dose gradient, the dose constraint of at least 1% volume of CSV was prescribed at 120% of the prescription dose to the target. The surrounding dose was then compressed by the ring. These structures (rings) were then expanded by 5 mm and 10 mm from the PTV. The 5% volume of these 5 mm and 10 mm rings structures were constrained at 80%вҖ“85% and at 50% of the prescription dose, respectively. The prescription dose had to cover at least 99% volume of the PTV (V100вүҘ99%), while the distance of the dose gradient from 100% to 50% of the prescription dose had to be within 10 mm for the single lesion. Furthermore, the maximal dose in the PTV was constrained to less than 125% of the prescribed dose, then the isodose level at least 80% of the maximal dose was encompassed the PTV volume for tomotherapy and VMAT. The maximal dose in the cylindrical collimator was accepted at less than 200% of the prescribed dose, whereas the isodose level at least 40% of the maximal dose was covered the PTV.
Treatment planning systems were composed of HT, VMAT, and Cone-based SRS. In our institution, the commissioning in VMAT was performed and SRS was initiated to deliver radiation treatments on December, 2018. Therefore, all patients that had experienced oligo-metastatic brain lesions before 2019 were actually treated by HT. After that point, patients received treatment by administering the VMAT technique. Every contouring dataset was re-planned in order to create each radiation dosimetry for all three treatment systems (HT, VMAT, and Cone-based). HT delivers radiation by way of a helical megavoltage fan beam. The Accuray Planning System (Hi-Art version 5.1.4) administers treatment plans through the employment of the helical treatment mode. In our study, the field width was set to ten millimeters in the fixed jaw mode. Modulation factor and pitch were set to 1.800вҖ“2.500 and 0.125, respectively. Based on the helical fan beam, a single isocenter coplanar technique was used in all treatment plans. The finest calculation grid was then selected (1.95 mm Г— 1.95 mm) for dose calculation. For VMAT, treatment plans were performed with the use of the Monaco version 5.11.03 treatment planning system. Modulated broad beam in a linear accelerator (Elekta Synergy) was applied with 5 mm of leaf width at the isocenter. All plans were created using the non-coplanar, single isocenter technique. Two full arcs (300В°) with a perpendicular collimator angle between each arc were used at 0В° of the couch angle. Specifically, 120В° of the treatment arc was used for three different couch angles (45В°, 270В°, and 315В°). The increment of the gantry angle was 10В° for all arc beams. The dose optimization was calculated through the 2.00 mm Г— 2.00 mm grid size whereas the fineness calculation grid (1.00 mm Г— 1.00 mm) was selected for the purposes of dose calculation. Treatment plans for the Cone-based approach were carried out using the Monaco version 5.11.03 (Elekta) treatment planning system. Different sizes (5вҖ“15 mm diameters depending upon target size) of the pencil beams in the linear accelerator were employed in the non-coplanar technique. The directions of the arc beam were set in a half sphere and intersections between each beam were avoided through multiple isocenters in the targets. The weighting radiation dose of each isocenter was applied according to the experience of the planner. The finest calculation grid (1.00 mm Г— 1.00 mm) was selected to establish the appropriate dose calculation.
Dosimetric comparisons of conformity index (CI), homogeneity index (HI), and gradient index (CGI) for each lesion were performed in order to compare the three techniques [12-14]. Relevant formulars were as follows:
where Vpres is the volume covered by prescribed dose and VPTV is the PTV volume.
where Dmax is a maximum dose in the PTV and DRx is the prescription dose.
where V50%Rx is the volume of 50% prescription isodose volume and VPTV is the PTV volume.
where Reff,50%Rx is an effective radius of 50% prescription isodose enclosing PTV and Reff,Rx is the prescription isodose enclosing PTV.
For beam-on time analysis, HT represented the beam-on time value of the unit of the second, whereas the others were determined by the monitor unit (MU). The MU of the Cone-based SRS technique was converted to the unit of the second through division of the dose rate. The highest dose rate of our Cone-based approach was recorded at 10 MU/s. In the case of this approach, the dose rate could directly divide the total MU of each plan. In the VMAT technique, various dose rates were used in each plan. The treatment planning system can be used to estimate beam-on time, but it is dependent upon the resolution of the calculation. A resolution of 2 mm was used in the optimization process to accelerate the optimization time, but a resolution of 1 mm was used to re-calculate the final absorbed dose. The result, then, was representative of the minimum beam-on time value, whereas various other dose rates were ignored in the VMAT technique.
Decision score analysis was used to evaluate the performance among the different SRS techniques [15]. The HT and VMAT approaches were benchmarked by applying the Cone-based technique. Significant differences of the plan quality indexes and dosimetric parameters were considered for the scoring procedure. Either plus one or minus one was granted to both the indexes and the parameters, which was indicative of either better or lesser performance than that of the Cone-based approach, respectively. The indexes and parameters received no score when no significant differences were observed.
2. Ethical approval
This study was approved by the Faculty of Medicine, Chiang Mai University of Institutional Research Board (No. 176/2560). Written informed consent was obtained from all participants who took part in this study.
3. Statistical analysis
Descriptive analyses were summarized as median values with interquartile range (IQR) for continuous characteristics and as frequencies and proportions for categorical characteristics. The total treatment time between HT and VMAT were compared using the Wilcoxon rank sum test. The association between PTV (incremental of 0.2 mL) and the quality of the plans for all three treatment modalities were evaluated using Spearman correlation test. The Friedman test was used to compare the dosimetric parameters and radiation painting to OARs, which were non-normally distributed between HT, VMAT, and the Cone-based planning techniques. The p-value reports were two-tailed with an alpha level of 0.05 to establish statistical significance. A pairwise comparison was performed to make comparison between the two treatment techniques and results were analyzed using Wilcoxon signed-rank test. The alpha level was adjusted to 0.0165 based on the Bonferroni correction for three comparisons. All analyses were conducted using Stata version 16 (StataCorp LP, College Station, TX, USA).
Results
A total of 21 patients with 39 lesions were included in this study. The most common tumor location was at the parietal region (15 out of 39 lesions, 38.5%) followed by the frontal (n = 9), temporal (n = 7), basal ganglion (n = 3), occipital (n = 3), and cerebellum (n = 2) regions, respectively. Ten patients had single lesions located at the parietal (n = 3), frontal (n = 2), temporal (n = 2), occipital (n = 1), basal ganglion (n = 1), and cerebellum (n = 1) regions. The median tumor size, which was measured at the maximal diameter, was 1.2 cm. Median GTV and PTV values were 0.8 mL (IQR, 0.2 to 4.7 mL) and 2.1 mL (IQR, 0.8 to 8.4 mL), respectively. The median prescription dose was 18 Gy. Eleven patients received SRS by HT, while the other 10 patients received radiation therapy by VMAT as is shown in Table 1. Median total treatment times, which started from patient set-up to finished radiation beam, were not determined to be statistically different between the HT and VMAT approaches at 39 minutes (IQR, 32 to 48 minutes) and 43 minutes (IQR, 41 to 48 minutes), respectively (p = 0.17). The isodose distribution values that were compared between the three different approaches for single and multiple lesions are presented in Fig. 3.
1. Dosimetric comparisons
Comparisons of the median values of Dmax (percentage of prescription dose), HI, CI, CI50, and CGI were made between HT, VMAT, and the Cone-based approaches. The results are presented in Table 2 and Supplementary Table S1. For the whole cohort, the Cone-based approach had the highest Dmax value, which was significantly higher than the HT and VMAT approaches. Moreover, the Cone-based approach provided a more heterogenous and a less conformed radiation dose to the target as it had the highest HI and CI values in our study. In term of the CGI value, the Cone-based approach revealed statistical significances that were better than HT while exhibiting a similar result when compared to the VMAT technique. The HT and VMAT techniques exhibited statistically identical Dmax, HI, and CI values. VMAT also exhibited the lowest CI50 value, while HT exhibited the poorest CGI value when compared to the other two techniques. For a single lesion, the Cone-based approach also revealed the highest Dmax and HI values while providing statistically similar CI, CI50, and CGI values when compared to the VMAT technique. HT exhibited poorer CI50 and CGI values than VMAT but provided better CI values than the Cone-based approach. For multiple lesions, the Cone-based technique still revealed the highest Dmax and HI values. The Cone-based approach also provided significantly better CGI values than the HT approach while exhibiting a trend when compared to VMAT (p = 0.017). Accordingly, VMAT exhibited better CI values than the Cone-based technique. In contrast, the HT approach provided the poorest CI50 and CGI values. The association between PTV volumes with an incremental value of 0.2 mL and quality of plans using Spearman correlation showed a significantly positive impact on Dmax (+0.22; p = 0.015) while revealed negative impacts on CI (-0.68; p < 0.001), CI50 (-0.81; p < 0.001), and CGI (-0.56; p < 0.001). Therefore, an increase in the PTV volume was associated with better CI50 value but poorer Dmax, CI and CGI results.
OARs and beam-on time comparisons were made and the results are presented in Table 3 and Supplementary Table S2. All three techniques delivered a similar integral dose (ID) to the whole brain. VMAT significantly provided the lowest whole brain volume, which was recorded at a dose of 5 Gy (BrainV5Gy) for the whole cohort. Lastly, VMAT also exhibited the lowest MU value and shortest beam-on time calculation value.
2. Decision score analysis
Radiation dose characteristics were compared to those of the Cone-based approach by evaluating each dosimetric parameter, each radiation painting of the normal structures, and by calculating beam-on time as has been presented in Table 4. However, Dmax and HI values were excluded from this analysis as high maximal dose and heterogeneity in PTV did not affect the clinical outcome of SRS. For the whole cohort, VMAT displayed superior performance in both dosimetric and OARs parameters, while HT exhibited lower performance in terms of dosimetric values. For the single lesion, HT revealed better performance only in terms of CI value, while the VMAT techniques exhibited identical performance in all parameters. For multiple lesions, VMAT exhibited superior performance in terms of both dosimetric and OARs parameters, while HT displayed inferior performance when compared with the Cone-based approach.
Discussion and Conclusion
The targeted-therapy and immunotherapy era is associated with improvements in the survival rate for tumor-controlled patients. Thus, treatment-associated toxicities must be carefully considered. The management for oligo-metastasis to the brain has gradually shifted from irradiating the whole brain to a more specific site. SRS has commonly been used as a primary radiation treatment among patients of this disease. Dosimetric analysis of each radiation technique has encouraged physicians to select an appropriate radiation modality. The outcomes of this study indicate the best CGI for Cone-based planning, as has been supported by the findings of a study conducted in Taiwan [16]. Hsu et al. [16] have evaluated the availability of SRS for spherical tumors using different radiation techniques. It was found that the Cone-based approach, in which cone-diameter matched tumor size, was associated with the best CI and CGI values. On the other hand, according to our results, the Cone-based approach exhibited poor CI and HI values when compared to the HT and VMAT approaches. The possible factors that were related to the worsening dosimetric data were tumor size, non-spherical shape, and the number of intracranial lesions. A larger tumor size would directly impact heterogenous radiation painting in the Cone-based approach. In this study, 11 out of 21 patients exhibited multiple brain metastases. Radiation homogeneity and conformality were found to be better in solitary brain lesions when compared to the multiple lesions observed in the Cone-based technique. These factors were associated with complex radiation planning through the use of multiple isocenters. The positioning accuracy established through intra-fractional movements, especially rotation, should be much higher when applied to multiple isocenters. Furthermore, the limitation of the small-sized pencil beams has resulted in multiple radiation beam directions.
VMAT displayed relatively excellent radiation output dose characteristics for SRS. This technique delivered a very steep radiation dose gradient as it had exhibited excellent CI50 and CGI values. Moreover, VMAT exhibited the lowest normal brain parenchymal volume, which had received a radiation dose of more than 5 Gy and the shortest estimated beam-on time value. Reducing radiation delivery duration decreased the intra-fractional motion and technically promoted the degree of personal comfort. In our center, these points are considered an important advantage of VMAT. Therefore, VMAT has been recognized as appropriate radiation SRS technique for our center which handles a massive workload. However, the results of the beam-on time estimation in the Elekta machine (including for the VMAT and Cone-based techniques) exhibited a minimal degree of deviation from the re-calculating process, while the beam-on time estimation in the HT approach exhibited an even greater level of preciseness.
HT was associated with identical Dmax, HI, and CI values but longer estimated beam-on time values when compared to VMAT. Among the three techniques, HT delivered the poorest CGI value. This outcome is related to the ordinarily helical coplanar beam direction that was employed in the HT technique. This factor restricts the steep radiation dose gradient, especially in the lateral dimension. However, HT can produce stereotactic radiation delivery at an acceptable radiation dose characteristic. According to the results of a study conducted in Italy, 68 patients receiving a median radiation dose of 18 Gy were studied. The outcomes supported the feasibility and tolerance for SRS using the HT technique [17].
Another common SRS modality is Gamma-Knife radiosurgery (GK). The outcome from a study conducted in China revealed applicable of Cone-based VMAT in a GK-free RT center [18]. They retrospectively analyzed dosimetric comparison between GK, Cone-based VMAT, and MLC-based conformal radiotherapy for small single brain metastases. The result showed better CI and HI, similar GI, but longer beam-on time for GK compared to Cone-based approach [18].
The decision score analysis in this study for single lesion indicated identical performance between VMAT and Cone-based techniques. For the whole cohort and multiple lesions, the decision score analysis clearly revealed a better degree of performance for all parameter domains in the VMAT technique. On the other hand, HT exhibited a lower performance in the dosimetric domain when compared to the Cone-based technique.
The strength of our study is a comprehensive comparison of radiation dosimetry among three different radiation approaches. These results can provide physicians with an even greater ability to select a suitable radiation technique that would be best suited for their own facilities. Moreover, the outcomes of these reports emphasize the usability of SRS in the IMRT technique over the Cone-based technique. However, small number of patients in this study lead to a major limitation that might interfere comparison analysis. Further clinical trial should include more patients to better evaluate these dosimetric results.
In conclusion, many RT modalities have been used to create SRS in the treatment of oligo-metastatic intracranial lesions. Each technique is associated with a unique radiation beam characteristic. Dosimetric comparison analysis has permitted physicians to choose an appropriate radiation technique that is compatible with their own facilities. Our study has effectively administered a comprehensive dosimetric comparison between three radiation techniques for single and multiple lesions. Consequently, the Cone-based technique revealed the highest HI and CGI values. On the other hand, VMAT reduced BrainV5Gy and exhibited the best estimated beam-on time value. For single lesion, VMAT and Cone-based approaches exhibited comparable performance for all parameter domains. For multiple lesions, VMAT provided an excellent performance than Cone-based technique while HT revealed a lower performance than the other two approaches.