A predictive model to guide management of the overlap region between target volume and organs at risk in prostate cancer volumetric modulated arc therapy
Article information
Abstract
Purpose
The goal of this study is to determine whether the magnitude of overlap between planning target volume (PTV) and rectum (Rectumoverlap) or PTV and bladder (Bladderoverlap) in prostate cancer volumetric-modulated arc therapy (VMAT) is predictive of the dose-volume relationships achieved after optimization, and to identify predictive equations and cutoff values using these overlap volumes beyond which the Quantitative Analyses of Normal Tissue Effects in the Clinic (QUANTEC) dose-volume constraints are unlikely to be met.
Materials and Methods
Fifty-seven patients with prostate cancer underwent VMAT planning using identical optimization conditions and normalization. The PTV (for the 50.4 Gy primary plan and 30.6 Gy boost plan) included 5 to 10 mm margins around the prostate and seminal vesicles. Pearson correlations, linear regression analyses, and receiver operating characteristic (ROC) curves were used to correlate the percentage overlap with dose-volume parameters.
Results
The percentage Rectumoverlap and Bladderoverlap correlated with sparing of that organ but minimally impacted other dose-volume parameters, predicted the primary plan rectum V45 and bladder V50 with R2 = 0.78 and R2 = 0.83, respectively, and predicted the boost plan rectum V30 and bladder V30 with R2 = 0.53 and R2 = 0.81, respectively. The optimal cutoff value of boost Rectumoverlap to predict rectum V75 >15% was 3.5% (sensitivity 100%, specificity 94%, p < 0.01), and the optimal cutoff value of boost Bladderoverlap to predict bladder V80 >10% was 5.0% (sensitivity 83%, specificity 100%, p < 0.01).
Conclusion
The degree of overlap between PTV and bladder or rectum can be used to accurately guide physicians on the use of interventions to limit the extent of the overlap region prior to optimization.
Introduction
Intensity-modulated radiation therapy (IMRT) is an inverse treatment planning process that optimizes the intensity distribution of a set of beams according to dose-volume histogram objectives chosen by planners, allowing for highly conformal treatment of a target while sparing organs-at-risk (OARs). IMRT has been shown to be particularly valuable compared to three-dimensional conformal radiation therapy (3D-CRT) when there is a significant overlap between the planning target volume (PTV) and an OAR [1,2,3]. Volumetric-modulated arc therapy (VMAT), the next generation of IMRT, allows for variation in the dose rate, speed of gantry rotation, and multi-leaf positions during rotation of the gantry in a full 360 degree arc, and has been shown to yield even further OAR sparing as compared to fixed-beam IMRT in prostate cancer [4,5]. However, regardless of the treatment delivery technique, if a large amount of overlap between PTV and OAR exist it may be physically impossible to achieve uniform coverage of the PTV with the prescription dose while also adequately sparing that OAR [6].
In prostate cancer radiotherapy, the PTV frequently overlaps the bladder and rectum with the degree of overlap dependent on patient anatomy, contouring technique (i.e., the way the prostate, bladder, and rectum are defined during treatment planning) and the PTV expansion used. While the overlap region generally makes up only a small percentage of the PTV, it is an important area to adequately treat given that most prostate cancer develops in the peripheral zone of the prostate [7,8]. Attempts have been made to spare patients some morbidity by excluding the OAR from PTV or intentionally under-dosing the overlap region [9,10], though the consequences of such techniques on tumor control probability are difficult to estimate.
In recent years, mathematical algorithms based on machine learning have been developed for head and neck cancer and prostate cancer fixed-beam IMRT through which planners can use the geometric relationship of the PTV and OAR to quantify and predict the achievable OAR sparing for an individual patient based on prior experiences from plans generated in previous patients [11,12]. The use of such modeling is somewhat limited in the sense that it is based on plans with the same features (i.e., beam configuration, beam energy, number of beams, etc.), and thus may be less accurate if any of these factors are changed for instance in VMAT, tomotherapy, or particle therapy. Nonetheless, these techniques have been used to streamline the treatment planning process and as a metric of quality control in IMRT planning [13]. Another issues is that while they provide ways in which a given overlap volume can be managed from a treatment planning perspective, they do not necessarily give the physician information on when it would be justifiable to take additional measures to reduce the overlap volume prior to optimization. Such measures in prostate cancer may include cytoreduction with androgen-deprivation therapy [14], the use of daily cone-beam computed tomography (CT) or implantable fiducials to safely reduce PTV margins through improved target localization [15,16,17], or the use of spacer gel injection between the prostate and rectum [18,19,20].
The goal of this project is to aid physicians in determining when interventions to reduce the overlap volume prior to treatment planning are most applicable to their patients, by quantitatively determining predictive equations and cutoff values for the overlap volume between the PTV and rectum (Rectumoverlap) or PTV and bladder (Bladderoverlap) above which the Quantitative Analyses of Normal Tissue Effects in the Clinic (QUANTEC) dose-volume constraints for these organs are unlikely to be achieved. A secondary objective was to determine whether the degree of overlap between PTV and OAR affects other aspects of plan quality besides the dose to that OAR, for instance the dose to other OARs, integral dose, conformity to the PTV or dose gradient. This study also represents an extension of overlap analysis to VMAT, as has not been undertaken in the previous IMRT studies. In this way, we sought to develop a front-end approach to managing the overlap region to complement the optimization algorithms described above.
Materials and Methods
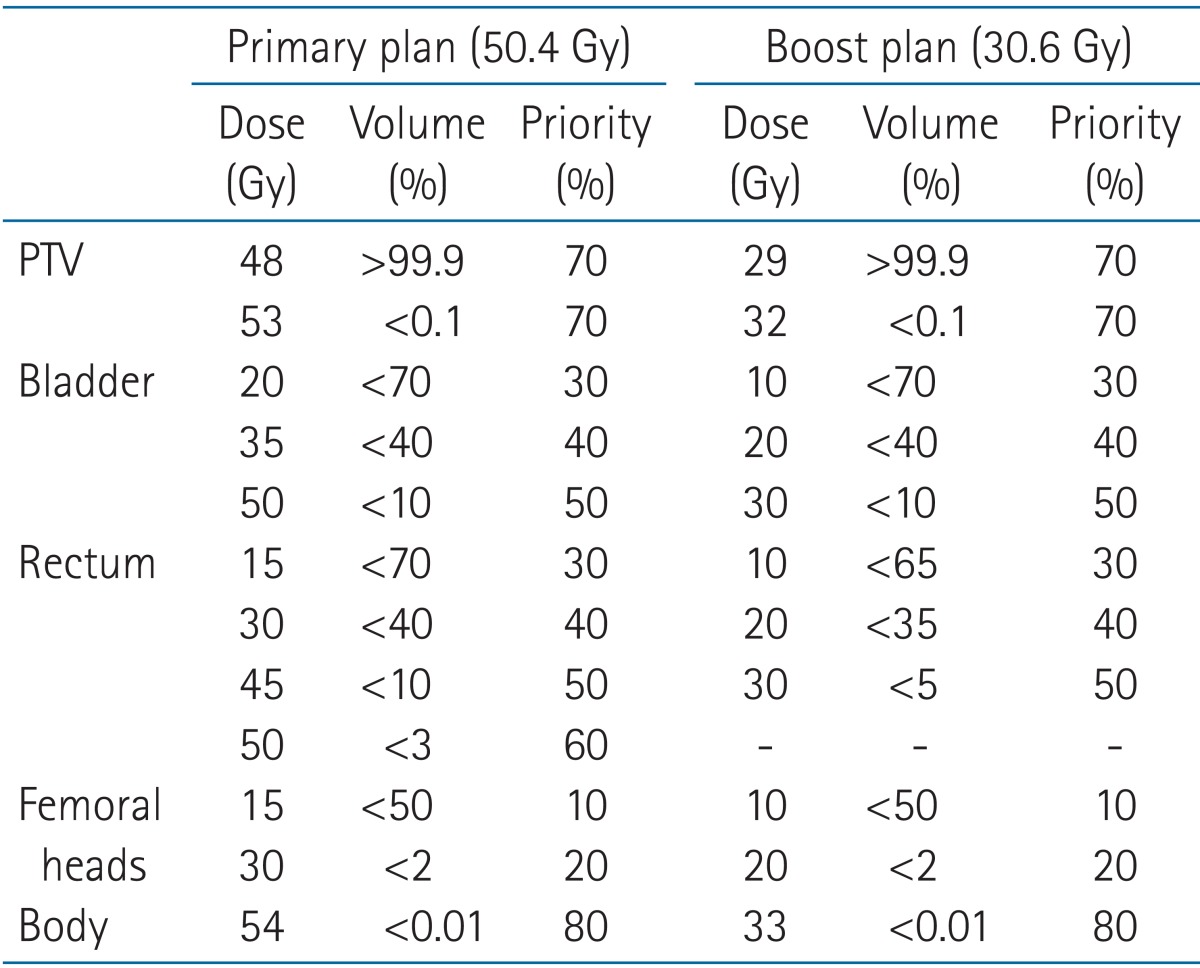
Fifty-seven consecutive patients with low risk prostate cancer (T1c-T2a, Gleason score <6, prostate-specific antigen <10) treated at our institution from 2011 to 2012 underwent CT simulation in the supine position with urethrogram. A target volume encompassing the prostate and entire seminal vesicles was prescribed to 50.4 Gy in 1.8 Gy fractions (primary plan), to be followed by a 30.6 Gy boost in 1.8 Gy fractions to the prostate and proximal seminal vesicles (boost plan), to a total dose of 81 Gy (summation plan). None of the target volumes included the whole pelvis or pelvic lymph nodes. The PTV for the primary plan included a 10-mm margin around the clinical target volume laterally, a 7-mm margin anteriorly and posteriorly, and a 7-mm superiorly and inferiorly, whereas the PTV for the boost plan included a 7-mm margin laterally and a 5-mm margin in all other directions. Rectal outer contours were outlined from the level of the ischial tuberosities to the level of the inferior border of the sacroiliac joints. The PTV, bladder, rectum, and femoral heads were delineated for each patient at the discretion of a single experienced radiation oncologist. VMAT plans were generated using 6 MV photons and two full arcs for the Varian iX linear accelerator (Varian Medical Systems, Palo Alto, CA, USA) using the Eclipse system (ver. 8.6) and identical optimization conditions as shown in Table 1. These optimization conditions for the primary and boost plans were chosen to be consistent with the clinical dose-volume constraints for a full course of prostate IMRT represented in the QUANTEC guidelines [21]. The analytical anisotropic algorithm was used for all dose calculations [22]. In our practice, VMAT is used for both the primary plan and the boost plan. All plans were normalized such that 98% of the PTV received 100% of the prescribed dose. All treatment plans involved in this study were generated exclusively for the purpose of this study, and were not used for the actual treatment of patients.
Percentage overlap was defined as the volume of overlap between a given PTV and OAR divided by the total volume of that OAR. Vx was defined as the volume of the OAR receiving more than dose x (Gy). The maximum and minimum doses to the PTV were defined as the highest and lowest dose, respectively, within 0.03 mL of the PTV. The normal tissue integral dose was calculated as the product of the mean dose to a region encompassing the normal tissue (excluding the PTV) inside the scanned region, and the volume of that region. The conformity index was calculated as (volume within the prescription isodose surface) / (volume of the PTV that is enclosed by the prescription isodose line), with a value closer to unity indicating greater conformity. The gradient measure was the difference in centimeters between the equivalent sphere radii of the prescription and half prescription isodose lines. A smaller gradient measure indicates higher dose gradients around the target.
The 57 patient cohort included in this study was divided according to chronology into a 29 patient training set and a separate 28 patient validation set. Using the training set, Pearson product-moment correlations were used to determine any associations between dose-volumetric parameters and the percentage overlap between the PTV and the rectum (Rectumoverlap) or PTV and the bladder (Bladderoverlap) [23]. Dose-volumetric parameters evaluated for the primary plans included bladder V50, V35, & V20, rectum V45, V30, & V15, mean dose to the femoral heads (femoral heads Dmean), maximum dose to the PTV (PTV Dmax), minimum dose to the PTV (PTV Dmin), normal tissue integral dose (NTID), conformity index (CI), gradient measure (GM), and monitor units (MUs). Dose-volumetric parameters evaluated for the boost plans included bladder V30, V20, & V10, rectum V30, V20, & V10, femoral heads Dmean, PTV Dmax, PTV Dmin, NTID, CI, GM, and MUs. Linear regression analyses were carried out on the training set for the primary and boost plans to determine predictive formulas for the high-dose region OAR constraints using the percentage Rectumoverlap and Bladderoverlap. Statistical comparison of the average sum of residuals (SRrectum and SRbladder) between training and validation cohorts was used to quantify the accuracy of the regression models. Receiver operating characteristic (ROC) curves were applied to the summation plans to determine if the boost plan percentage Rectumoverlap and Bladderoverlap could predict generation of a plan that deviated from the QUANTEC high-dose-region constraints of Rectum V75 <15% and Bladder V80 <15%. The cutoff values generated by this method were applied to the validation set to determine their performance in classifying whether plans would meet these constraints. Statistical analysis was performed using Statistical Package for Social Sciences 20.0 (IBM Corporation, Chicago, IL, USA) and Microsoft Excel 2007 (Microsoft Corporation, Redmond, WA, USA). A p-value less than 0.05 was considered statistically significant.
Results
For the primary plan, the median Rectumoverlap for the entire cohort of patients was 3.58 cm3 (range, 0.62 to 16.68 cm3), or 6.52% of the median rectum volume (range, 0.84% to 17.08%). The median Bladderoverlap was 5.91 cm3 (range, 1.08 to 23.94 cm3), or 4.68% of the median bladder volume (range, 1.48% to 17.16%). The median percentage Rectumoverlap of the training set was 6.87% (range, 1.36% to 17.08%), whereas that of the validation set was 6.37% (range, 0.84% to 13.11%). The median percentage Bladderoverlap of the training set was 4.53% (range, 1.65% to 17.16%), whereas that of the validation set was 5.30% (range, 1.48% to 16.22%). Neither of these differences were statistically significant (p = 0.71 and p = 0.58, respectively). Pearson correlations between the primary plan Rectumoverlap or Bladderoverlap and dose-volumetric parameters are shown in Table 2. Of the parameters tested, there were statistically significant associations between Rectumoverlap and Rectum V45 (r = 0.883, p < 0.01), V30 (r = 0.588, p < 0.01) and V15 (r = 0.437, p < 0.01), and CI (r = 0.419, p = 0.01). There were also statistically significant associations between Bladderoverlap and Bladder V50 (r = 0.911, p < 0.01), V35 (r = 0.746, p < 0.01), and V20 (r = 0.595, p < 0.01). On linear regression analysis (Fig. 1A, B), the equation [1.05 × (percentage Rectumoverlap) + 8.79] predicts Rectum V45 with an R2 of 0.78 (p < 0.01), and the equation [1.02 × (percentage Bladderoverlap) + 2.91] predicts Bladder V50 with an R2 of 0.83 (p < 0.01), indicating that the full models accounts for 78% and 83% of data variability, respectively. The predictive abilities of the regression models for the primary plan were statistically indistinguishable between the training and validation sets, with SRRectum = -0.31 ± 2.03 and SRBladder = 0.56 ± 2.24 for the validation set (Fig. 2A, B).
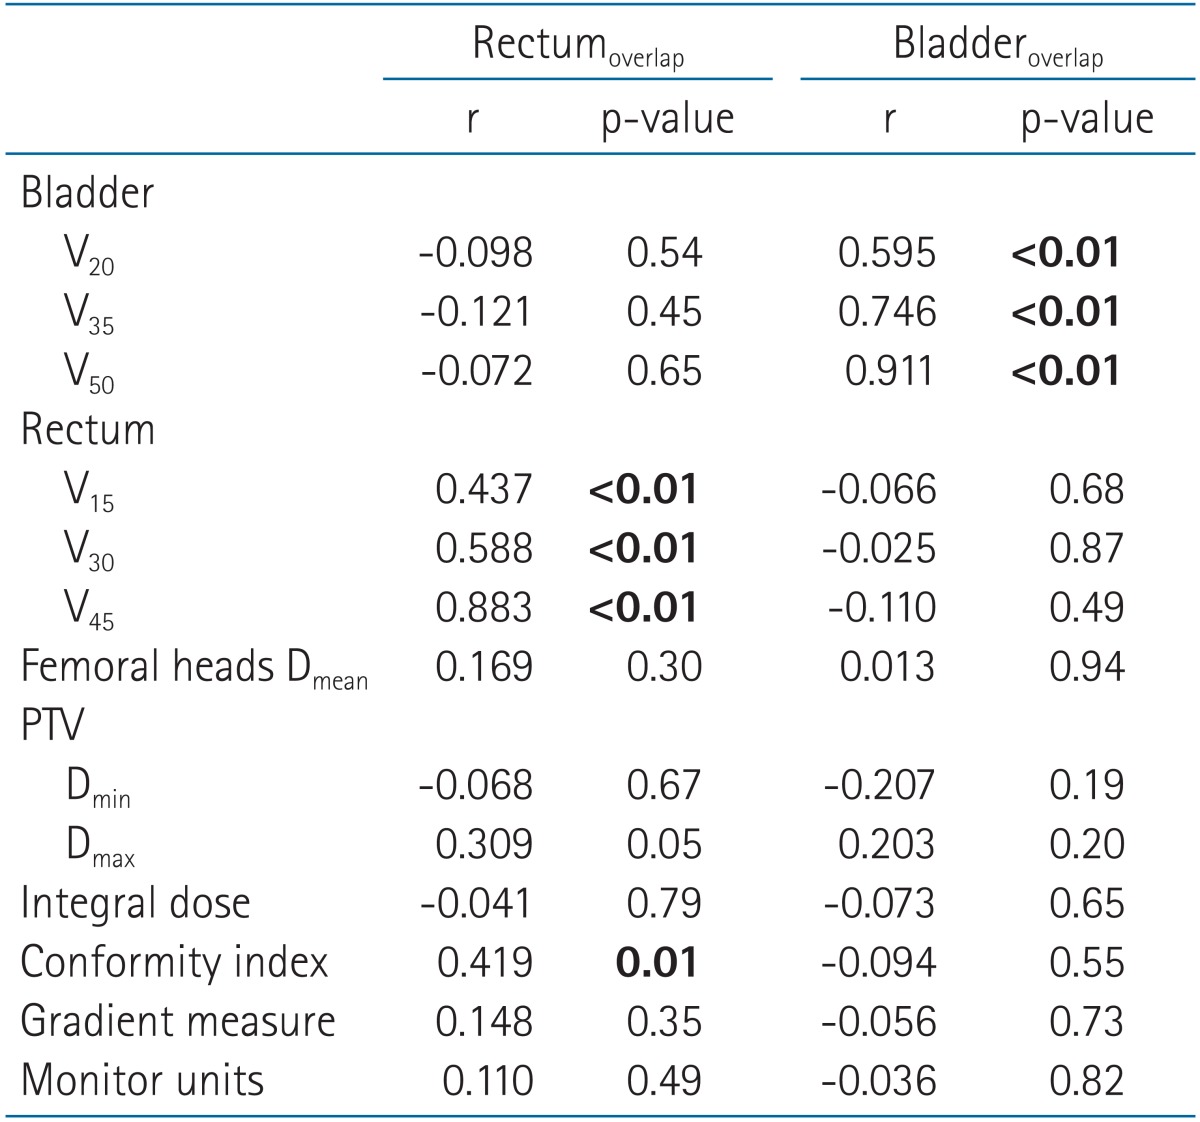
Pearson product-moment correlations (r) associating the percentage overlap between the PTV and OARs (Rectumoverlap and Bladderoverlap, respectively) with dose-volumetric parameters for the primary plans
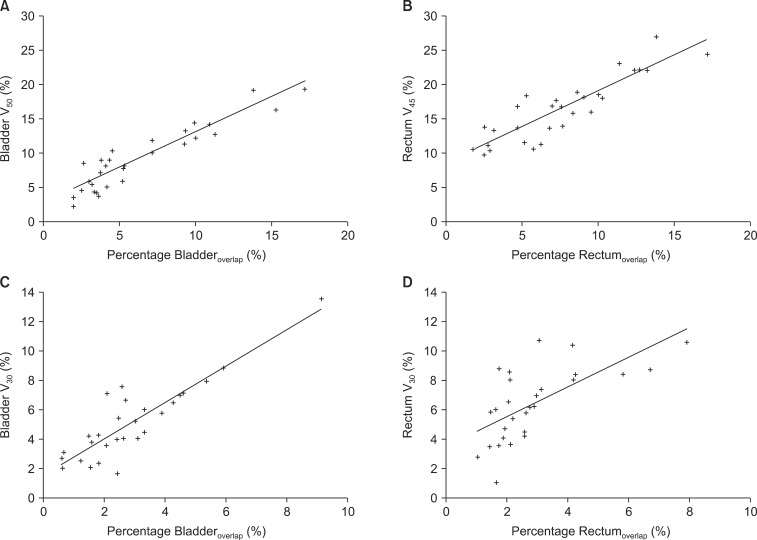
Linear regression analysis using the percentage overlap between the planning target volume and organs-at-risk to predict the Bladder V50 and Rectum V45 for the primary plan (A, B) and Bladder V30 and Rectum V30 boost plan (C, D).
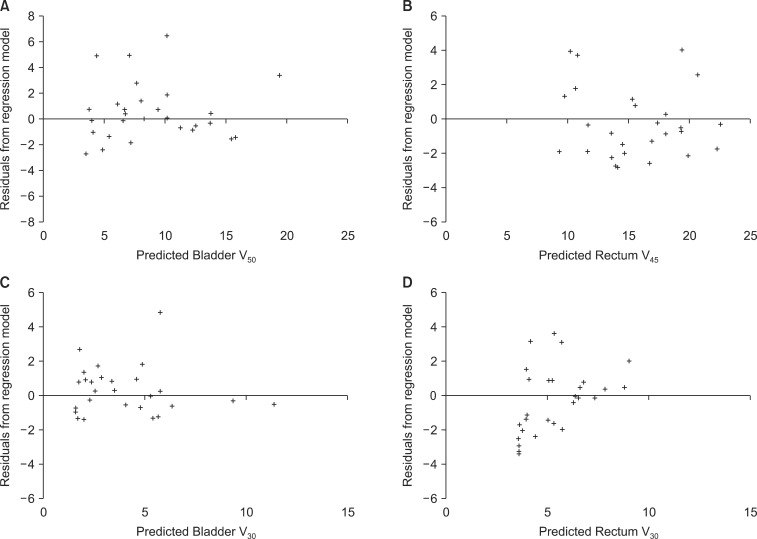
Residual values for the validation set using the linear regression models generated to predict the Bladder V50 and Rectum V45 for the primary plan (A, B) and Bladder V30 and Rectum V30 boost plan (C, D).
For the boost plan, the median Rectumoverlap for the entire cohort of patients was 1.18 cm3 (range, 0.10 to 6.39 cm3), or 2.11% of the median rectum volume (range, 0.56% to 7.92%). The median Bladderoverlap was 2.32 cm3 (range, 0.31 to 11.36 cm3), or 2.08% of the median bladder volume (range, 0.37% to 9.11%). The median percentage Rectumoverlap of the training set was 2.16% (range, 0.95% to 7.92%), whereas that of the validation set was 2.11% (range, 0.56% to 5.33%). The median percentage Bladderoverlap of the training set was 2.04% (range, 0.42% to 9.11%), whereas that of the validation set was 2.23% (range, 0.37% to 7.87%). Neither of these differences were statistically significant (p = 0.94 and p = 0.86, respectively). Pearson correlations between the boost plan Rectumoverlap or Bladderoverlap and dose-volumetric parameters are shown in Table 3. Of the parameters tested, there were statistically significant associations between Rectumoverlap and Rectum V30 (r = 0.728, p < 0.01) and V20 (r = 0.413, p < 0.01). There were also statistically significant associations between Bladderoverlap and Bladder V30 (r = 0.901, p < 0.01), V20 (r = 0.623, p < 0.01), and V10 (r = 0.460, p < 0.01). On linear regression analysis (Fig. 1C, D), the equation [1.02 × (percentage Rectumoverlap) + 3.51] predicts Rectum V30 with an R2 of 0.53 (p < 0.01), and the equation [1.25 × (percentage Bladderoverlap) + 1.54] predicts Bladder V30 with an R2 of 0.81 (p < 0.01), indicating that the full models accounts for 53% and 81% of data variability, respectively. The predictive abilities of the regression models for the boost plan were statistically indistinguishable between the training and validation sets, with SRRectum = -0.28 ± 1.94 and SRBladder = 0.28 ± 1.40 for the validation set (Fig. 2C, D).
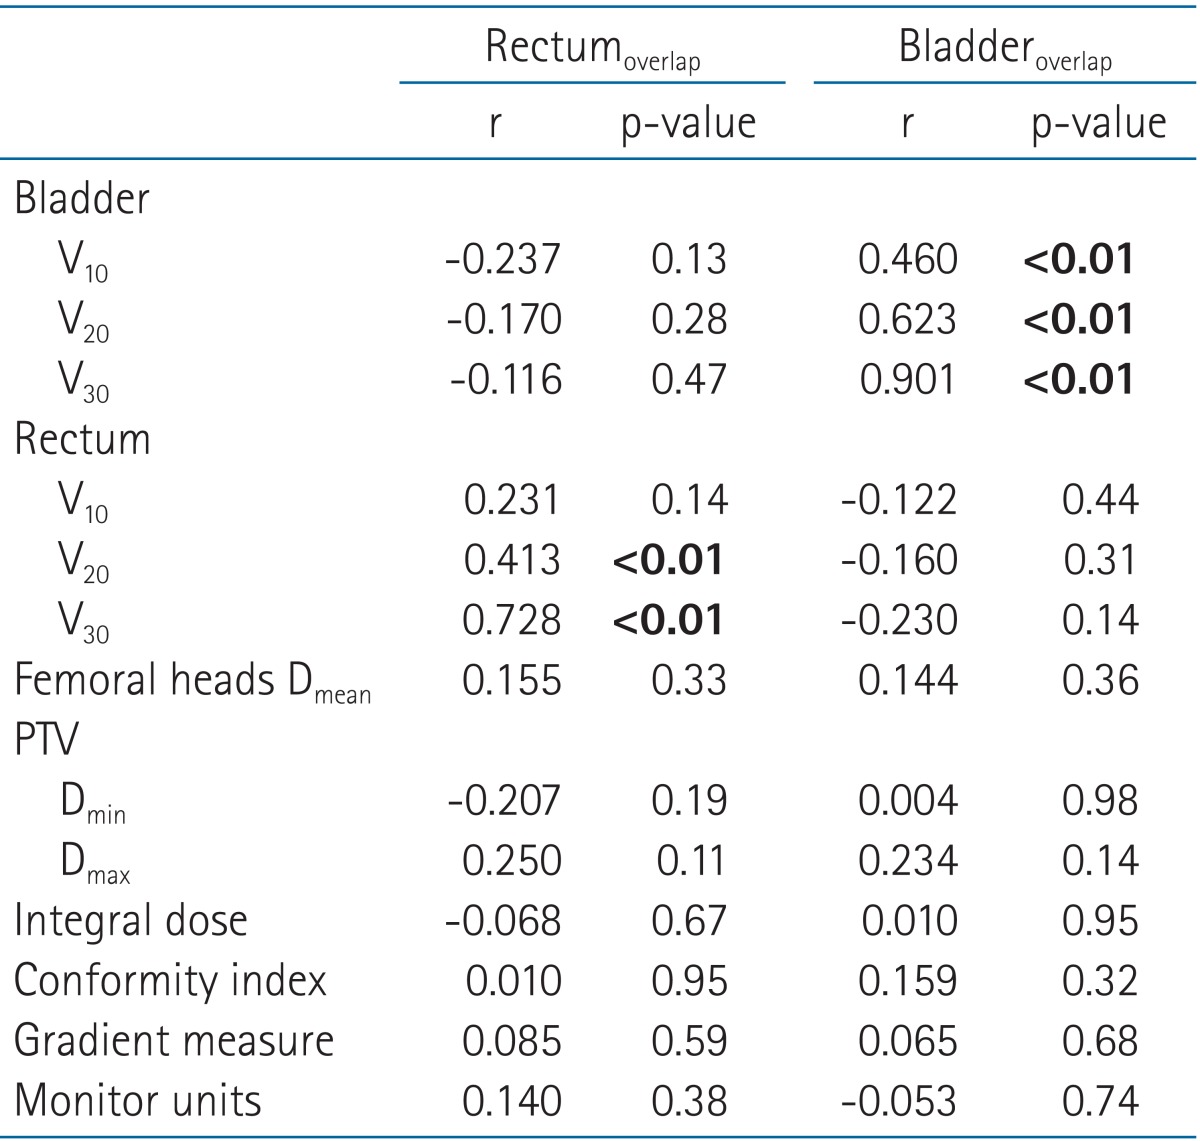
Pearson product-moment correlations (r) associating the percentage overlap between the PTV and OARs (Rectumoverlap and Bladderoverlap, respectively) with dose-volumetric parameters for the boost plans
According to the ROC method, the optimal cutoff value of boost Rectumoverlap to predict summation plan Rectum V75 >15% was 3.5% (sensitivity 100%, specificity 94%, area under the curve [AUC] 0.974, 95% confidence interval [CI] 0.935 to 1.000, p < 0.01), and the optimal cutoff value of boost Rectumoverlap to predict Rectum V75 >10% was 1.5% (sensitivity 83%, specificity 86%, AUC 0.905, 95% CI 0.831 to 0.980, p < 0.01). There were only two patients in our cohort with bladder V80 >15%. However, the optimal cutoff value of boost Bladderoverlap to predict Bladder V80 >10% was 5.0% (sensitivity 83%, specificity 100%, AUC 0.984, 95% CI 0.949 to 1.000, p < 0.01). Using our validation set of 28 additional patients, the three testing algorithms above appropriately categorized 93%, 86%, and 93% of patients, respectively.
Discussion and Conclusion
In prostate cancer radiotherapy, the degree of overlap between the rectum and PTV has been shown to be the most important predictor of benefit from IMRT as compared to 3D-CRT [1,2,3], determines the limits of dose escalation possible [6,24], and can predict the degree of rectal sparing after hydrogel injection [18]. Similarly, in this study we have shown that the degree of overlap between PTV and bladder or rectum adversely effects sparing of that organ not only in the high-dose region of the dose-volume histogram, but also in the low-dose region as well. Although we speculated that the degree of overlap between PTV and OAR might affect other aspects of plan quality besides the dose to that OAR under our given set of optimization conditions, we found that the degree of overlap actually had minimal impact on the femoral head dose, integral dose, CI, GM, and MUs.
Several studies have also shown that the geometric relationship between PTV and OARs can be used to guide IMRT treatment planning. Some of the earliest reports of this were in the context of sparing the parotid glands in head and neck cancer [25,26,27,28], but more recently these methods have also been applied to prostate cancer [11,12,13]. Similarly, we have shown that the percentage overlap between PTV and bladder or rectum can be used to estimate rectal and bladder dose prior to optimization, and cutoff values for these overlap regions can be applied to accurately predict with a high sensitivity and specificity which plans are likely to deviate from the QUANTEC high-dose-region rectal and bladder dose-volume constraints. As such, whereas prior studies have been geared more towards treatment planning, the value of our study is that it provides a relatively simple front-end approach to guide "management" of the overlap region prior to optimization by identifying patients who are highly unlikely to achieve a dose-escalated treatment to the prostate while sparing OARs. This enables individualized, anatomy-specific guidance on the judicious use of additional measures to reduce the overlap volume prior to treatment planning. Furthermore, all of the above studies were carried out using IMRT, whereas our work extends similar principles to VMAT. It should be noted that the models generated in all of these studies (including our own) are dependent on the specific characteristics of the plan, prescription, and delivery, though our relatively common approach should be widely applicable (at least in principle) in clinical practices using VMAT.
There are several limitations to this study. First, this was a treatment planning system study only, and actual dose delivered from the generated plans was not measured. As such, toxicity data is not available, though this has been reported previously [29,30]. Another limitation to the concept of using the PTV-OAR overlap to stratify patients is that it is not meaningful when the OAR and target do not overlap (but are merely close to overlapping), thus having the potential to oversimplify the relative spatial configuration of the PTV and OAR. As described by Wu et al. [27], while the more complex overlap volume histogram method would resolve much of this issue, we would contend that looking at the overlap alone provides a sufficient amount of information in a disease like prostate cancer, in which the PTV for both the primary and boost plans will overlap bladder and rectum to varying extents in virtually all patients when using the RTOG-recommended 5 to 15 mm margins around the prostate. Moore et al. [13] also confirmed that relying on the overlap volume as a geometric indicator was a straightforward and sufficient means of developing a prostate cancer IMRT quality control tool.
In this study, we have shown that the overlap between PTV and bladder or rectum adversely effects sparing of that organ. Regression equations can be applied to the percentage overlap volume to accurately predict the ability of VMAT planning to achieve high-dose region constraints for a given OAR in the primary and boost plans, and a percentage overlap between the boost plan PTV and rectum greater than 3.5% of the total rectal volume was highly predictive of a plan with a Rectum V75 exceeding the QUANTEC constraint of 15%. This information has the potential to enable clinicians to tailor technology and treatment decisions in a patient-specific manner based on the anatomy of the patient.
Notes
No potential conflict of interest relevant to this article was reported.
