PET/CT planning during chemoradiotherapy for esophageal cancer
Article information
Abstract
Purpose
To evaluate the usefulness of positron emission tomography/computed tomography (PET/CT) for field modification during radiotherapy in esophageal cancer.
Materials and Methods
We conducted a retrospective study on 33 patients that underwent chemoradiotherapy (CRT). Pathologic findings were squamous cell carcinoma in 32 patients and adenocarcinoma in 1 patient. All patients underwent PET/CT scans before and during CRT (after receiving 40 Gy and before a 20 Gy boost dose). Response evaluation was determined by PET/CT using metabolic tumor volume (MTV), total glycolytic activity (TGA), MTV ratio (rMTV) and TGA ratio (rTGA), or determined by CT. rMTV and rTGA were reduction ratio of MTV and TGA between before and during CRT, respectively.
Results
Significant decreases in MTV (MTV2.5: mean 70.09%, p < 0.001) and TGA (TGA2.5: mean 79.08%, p<0.001) were found between before and during CRT. Median rMTV2.5 was 0.299 (range, 0 to 0.98) and median rTGA2.5 was 0.209 (range, 0 to 0.92). During CRT, PET/CT detected newly developed distant metastasis in 1 patient, and this resulted in a treatment strategy change. At a median 4 months (range, 0 to 12 months) after completion of CRT, 8 patients (24.2%) achieved clinically complete response, 11 (33.3%) partial response, 5 (15.2%) stable disease, and 9 (27.3%) disease progression. SUVmax (p = 0.029), rMTV50% (p = 0.016), rMTV75% (p = 0.023) on intra-treatment PET were found to correlate with complete clinical response.
Conclusion
PET/CT during CRT can provide additional information useful for radiotherapy planning and offer the potential for tumor response evaluation during CRT. rMTV50% during CRT was found to be a useful predictor of clinical response.
Introduction
Esophageal cancer has a high mortality rate worldwide, and current-treatment outcome remains poor with an estimated 5-year survival rate of 17% [1]. Because better local control is associated with increased survival, several approaches have been used to improve local control. Combined chemoradiotherapy (CRT) is one such approach, and can be used either as definitive therapy or in the neoadjuvant setting. The best chance for cure remains surgical resection, but many patients already have advanced disease at diagnosis and in these patients CRT has been reported to result in survival rates comparable to surgery alone [2].
Precise detection of gross disease is an important step in radiotherapy (RT). In addition, accurate delineation of primary tumor volume and involved regional lymph nodes is required. For this reason, imaging techniques with satisfactory diagnostic performance are used at all RT sessions. Functional tumor imaging tools, such as positron emission tomography (PET) with 18F-fluorodeoxyglucose (FDG), can show the functional status of a tumor through the visualization of its metabolic activity. For primary tumors, PET scans in esophageal cancer have a sensitivity ranging from 95% to 100% and a specificity of 100% [3]. Because of its higher accuracy to differentiate malignant and normal tissues, PET/computed tomography (CT) can be incorporated into RT planning to improve the accuracy of the target volume delineation process and modify treatment plans [4,5,6,7]. Furthermore, PET can provide effective evaluations of response to treatment in esophageal cancer and additional information to aid the prediction of pathologic response to neoadjuvant treatment [8].
The purpose of this study was to determine the efficacy of PET/CT for field modification planning during RT in patients with esophageal cancer. During CRT (total dose 60 Gy), RT plan modification was needed to spare normal tissues and we used to PET/CT for RT planning purpose. Gross tumor volumes (GTVs) were separately defined using CT-only and PET/CT-based datasets and then compared using an index of conformity. We hypothesized tumor FDG activity changes, such as metabolic tumor volume changes during CRT, would resulted in RT field modifications and aid the prediction of clinical response.
Materials and Methods
1. Patients and treatment
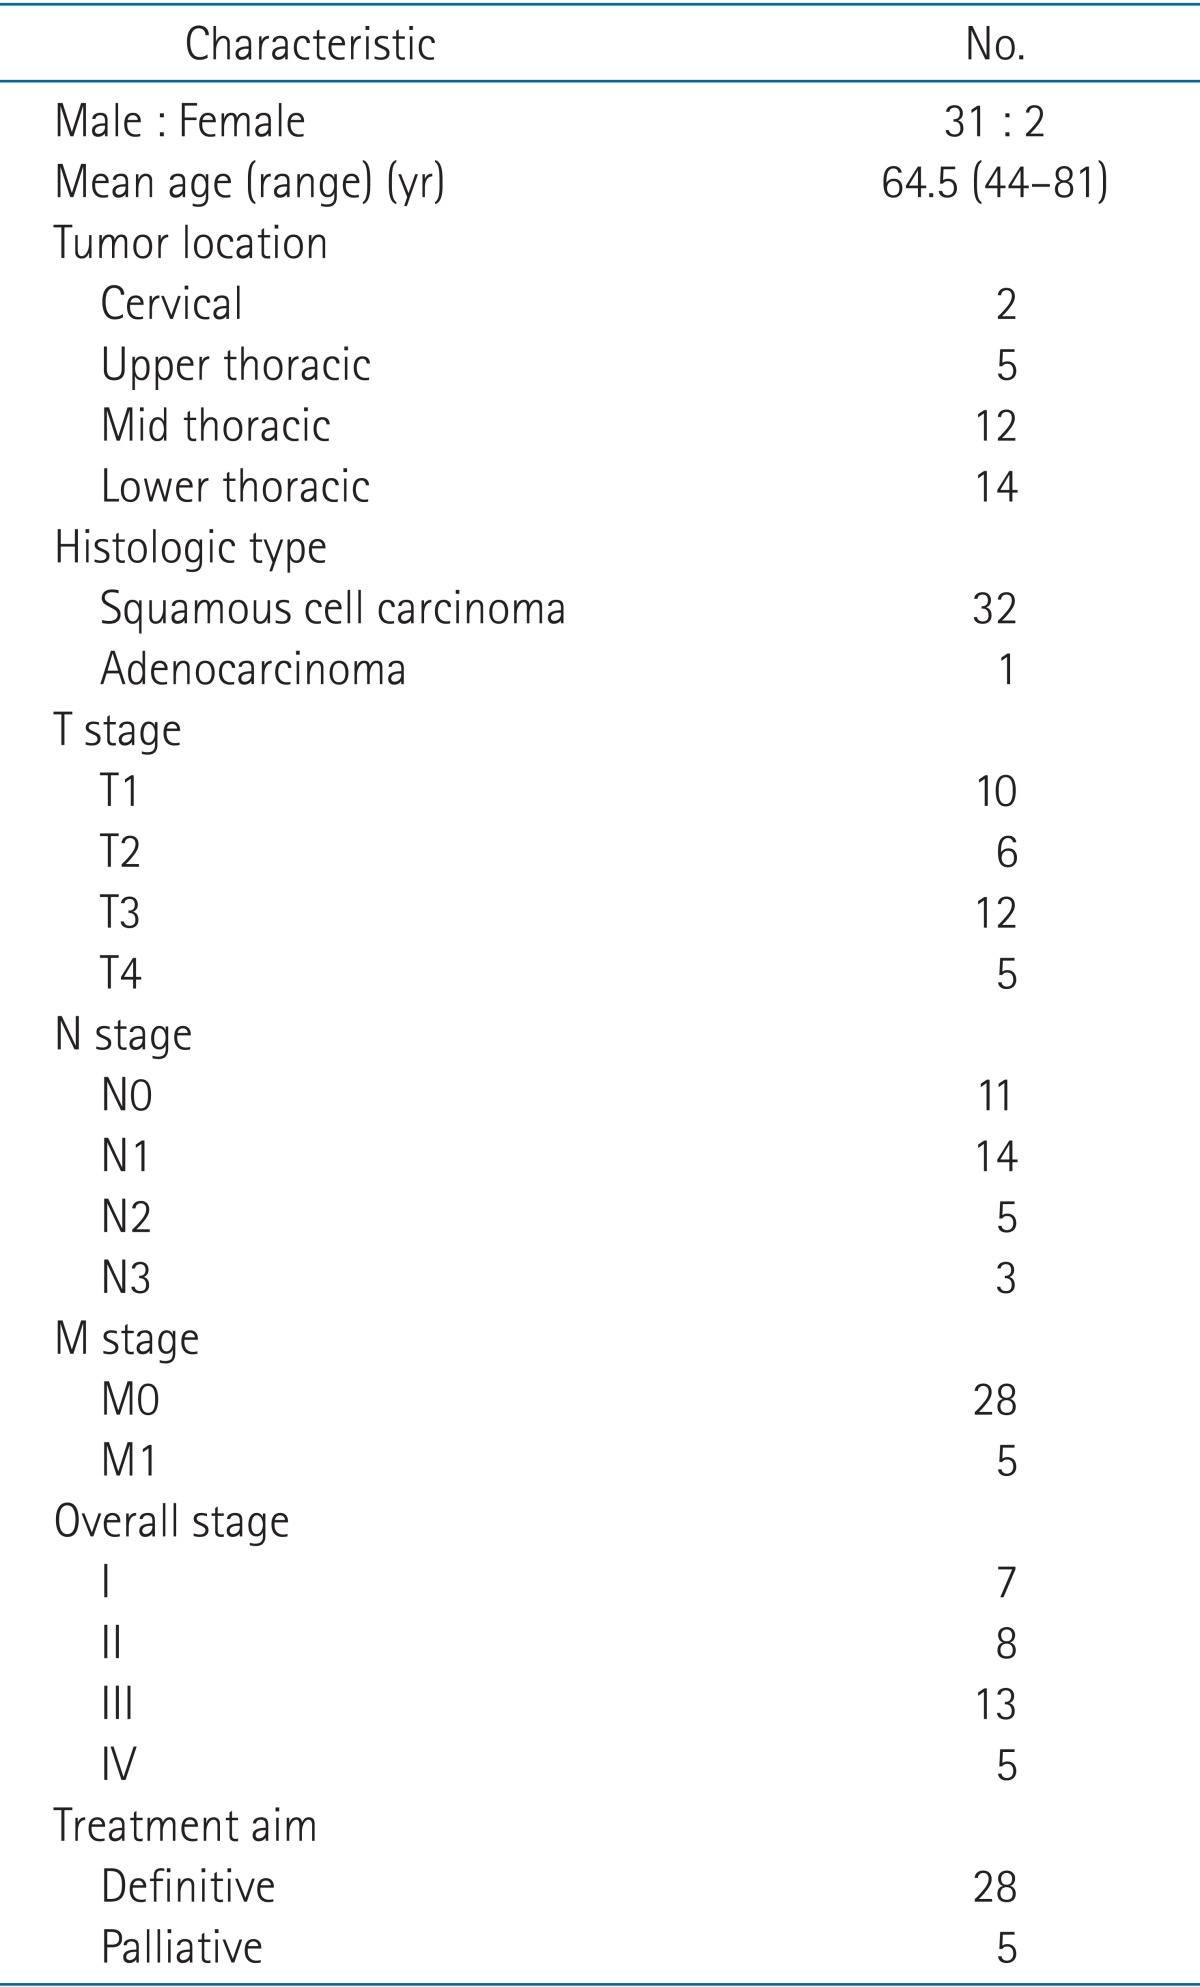
We conducted this retrospective study on patients with a diagnosis of esophageal cancer and patients were treated by CRT that underwent a PET/CT scan before and during CRT (pre-CRT and intra-CRT PET/CT) at our institution between March 2011 and April 2012. Thirty-three patients (31 males, 2 females) were included in the analysis. The median age was 64 years (range, 44 to 81 years). The stage distribution according to the American Joint Committee on Cancer stage was as follows: 7 (21.2%) in stage I; 8 (24.2%) in stage II; 13 (39.4%) in stage III; 5 (15.2%) in stage IV [9]. Staging was determined by endoscopy, contrast enhanced esophagus CT, and whole body PET/CT. Pathologic findings were squamous cell carcinoma in 32 patients and adenocarcinoma in one patient. All 33 patients underwent a PET/CT scan before CRT for staging and again during CRT (at 40 Gy) for boost RT planning purposes. Details of patient characteristics are provided in Table 1.
Radiation was delivered once daily, 5 days per week, using at 2 Gy per fraction. The protocol of RT consisted of an initially 40 Gy for over 4 weeks and an additional 20 Gy boost irradiation over 2 weeks with a total prescribed dose of 60 Gy. The initial field was anterior-posterior/posterior-anterior 2 portals up to 40 Gy and the boost field was opposed oblique or 4 fields up to 20 Gy. During the initial 40 Gy irradiation, the clinical target volume (CTV) consisted of the primary lesions and regional nodal regions with a 5-cm craniocaudal and 2-cm circumferential margin. According to tumor location, elective regional lymph nodal areas were included in CTV. For tumors involving the cervical and upper-thoracic esophagus, the supraclavicular nodal areas were electively included, and for tumors involving the lower-thoracic and gastroesophageal junction, the cardiac and celiac nodes were included for prophylaxis.
After administering the initial 40 Gy, PET/CT scans were acquired for boost planning at a median 30 days (range, 28 to 66 days) after the commencement of CRT. The visual interpretation of PET images was used to delineate GTV on PET/CT for boost planning [10]. Visually interpreted PET images were used to determine the natures of tumor lesions. CT images were used to determine anatomical boundaries, such as the esophageal outer wall. To investigate the impact of PET/CT fusion on RT planning, a radiation oncologist with experience of esophageal cancer and pre-CRT examination results, but with unaware of PET data, delineated GTVs on CT datasets (Fig. 1) [7]. For boost planning, CTV was defined as the primary tumor and involved lymph nodes with an approximately 3- to 4-cm craniocaudal margin and 1-cm circumferential margin. The irradiation beams conformed on the basis of the 3D visualization of the various anatomic volumes. Beam shaping was performed using the multi-leaf collimator. The radiation dose to the spinal cord did not exceed 45 Gy [11]. Treatment planning was performed using commercial planning software (Eclipse; Varian Medical System, Palo Alto, CA, USA).

Comparison of gross tumor volume (GTV) delineation for computed tomography (CT) alone (left, indicated in red) and positron emission tomography (PET)/CT (right, indicated in yellow). PET/CT detected a pathologic lesion on postero-lateral esophageal wall whereas CT indicated esophageal wall thickening.
The chemotherapy regimens administered included 5-fluorouracil plus cisplatin in 30 patients, capecitabine plus cisplatin in one patient, 5-fluorouracil alone in one, and docetaxel plus cisplatin in one. With the exception of one patient, who was treated with 2 cycles of 5-fluorouracil plus cisplatin after completing RT, 32 patients underwent concurrent CRT (CCRT). Six patients received adjuvant chemotherapy based on the clinical outcomes of CCRT.
2. PET acquisition and imaging interpretation
Our integrated PET/CT imaging protocol required that all patients fasted for at least 6 hours, and a blood glucose level was performed before the administration of 18F-FDG. Patients with an elevated blood glucose level had their examinations rescheduled and blood glucose concentration was managed to be less than 150 mg/dL in all subjects. Approximately 8.1 MBq of 18F-FDG per kilogram of body weight was injected intravenously, and patients were then advised to rest for 1 hour before the acquisition of PET/CT images. PET/CT scans were performed using a Reveal RT-HiREZ 6-slice CT apparatus (CTI Molecular Imaging, Knoxville, TN, USA). Before the PET scan, for attenuation correction a low-dose CT scan without contrast enhancement was obtained with the patient supine and breathing quietly, from the skull vertex to the knees for examination or from the upper neck through to the liver for planning purposes. During PET/CT for the boost plan, with a patient positioned supine and straightened, arms were generally placed overhead the same as treatment position. PET scans with a maximum spatial resolution of 6.5 mm (Reveal PET/CT) were also obtained at 3 minutes per bed position. PET images obtained by the Reveal PET/CT were reconstructed with a 128 × 128 matrix, an ordered-subset expectation maximum iterative reconstruction algorithm (4 iterations, 8 subsets), a Gaussian filter of 5.0 mm, and a slice thickness of 2.5 mm (Reveal PET/CT).
Computer-aided measurements were obtained for all PET scans. We studied standard uptake value (SUV) based on metabolic tumor volume (MTV) or total glycolytic activity (TGA) for all patients. Several parameters were used in the study: maximum standard uptake value (SUVmax), MTV, TGA, MTV ratio (rMTV), and TGA ratio (rTGA). SUVmax, MTV, and TGA can be readily measured semi-automatically with a dedicated software algorithm. The MTVx was defined as the volume within a tumor with a SUV greater than the minimum threshold values x, and determined for pre-CRT and intra-CRT PET. Similarly, the TGA defined as the mean SUV × MTVx, was calculated using the same thresholds. To determine targeted MTV or TGA, we used SUV cutoff values (x) of 2.0, 2.5, or 3.0, and cutoff values of 25%, 50%, or 75% of SUVmax. Because recent studies suggested that a SUV 2.5 is an optimal threshold for gross tumor delineation, we focused on a SUV cutoff of 2.5 [12,13,14,15]. rMTV and rTGA were defined as ratios of respective MTV and TGA values measured on PET/CT images during and before CRT, respectively. For example, rMTVx was defined as intra-CRT MTVx divided by pre-CRT MTVx. Thus, a rMTV of <1, indicates a reduction in MTV during initial CRT.
Pre-CRT and intra-CRT MTVs based on GTVs obtained using the fused PET/CT dataset were compared, as were the predictive values of SUV, MTV, and TGA on intra-CRT PET scans and PET parameters and clinical outcomes post-CRT. Recent studies indicated that a SUV cutoff of 2.5 may be an optimal threshold for gross tumor delineation [12,13,14,15].
3. Analysis of clinical response
After CRT (post-CRT), clinical outcomes were evaluated by physical examination, by conventional imaging, such as endoscopy, and by contrast enhanced CT and PET/CT. Response evaluations were conducted using MTV PET/CT values, TGAs, rMTVs and rTGAs, or using CT-based revised Response Evaluation Criteria in Solid Tumors (RECIST) criteria (2009) [16]. Clinical responses to CRT as determined by conventional imaging modalities, were divided into four groups, as follows: complete response (cCR), disappearance of tumor; partial response (cPR), a decline of at least 65% in tumor volume; stable disease (cSD), neither partial response nor progressive disease; and progressive disease (cPD), at least a 70% increase in tumor volume. Metabolic responses of primary tumors by post-CRT PET were divided into two groups: metabolic complete remission (mCR) if tumor FDG activity decreased to less than the background of liver parenchyma and metabolic residual tumor (mPR), defined as at least a 30% decrease in SUVmax between the most intense pre-therapy lesion and the most intense post-therapy lesion. In cases with no visible lesion by pre-CRT PET, SUVs were arbitrarily designated as 0.5 of the baseline or background FDG uptake level [8].
Regarding intra-CRT PET/CT for RT planning purposes, metabolic response was divided into two groups: metabolic responders and metabolic non-responders. Patients whose tumor SUVmax had decreased by 35% or more, indicating an obvious decrease in tumor glucose uptake and viability, were defined as metabolic responders [17].
4. Statistical analysis
Statistical analysis was conducted using SPSS ver. 19.0 (SPSS Inc., Chicago, IL, USA). All quantitative data are expressed as mean ± standard deviation. Relations between tumor metabolic response and pre-CRT PET parameters and intra-CRT PET parameters were explored using Wilcoxon signed-rank test, and GTV values as determined by CT and PET/CT were compared using the paired t-test. Associations between clinical responses and PET parameters were assessed using the Mann-Whitney test, chi-square test, or Fisher exact test. Overall survival was calculated from the first day of CRT, survival rates were calculated using the Kaplan-Meier method. Statistical comparisons between two patient groups were performed using the log-rank test. Statistical significance was accepted for p-values <0.05.
Results
1. Metabolic tumor volume changes and target volume modifications
After initial 40 Gy has been administered, 23 patients (77%) achieved metabolic responses that tumor SUVmax reduction of >35%. There was significant decrease in MTV (MTV2.5: mean 70.1%, p<0.001) and in TGA (TGA2.5: mean 79.1%, p<0.001) between pre-CRT and intra-CRT. Median rMTV2.5 was 0.299 (range, 0 to 0.98) and median rTGA2.5 was 0.209 (range, 0 to 0.92). The statistically significant differences in SUVmax, MTV, and TGA as determined by PET pre-CRT vs. intra-CRT are shown in Table 2. Remarkable individual differences in rates of reduction were observed for primary tumors pre-CRT vs. intra-CRT, and these findings resulted in target volume reductions in boost plans. Fig. 2 shows an example of boost RT planning.
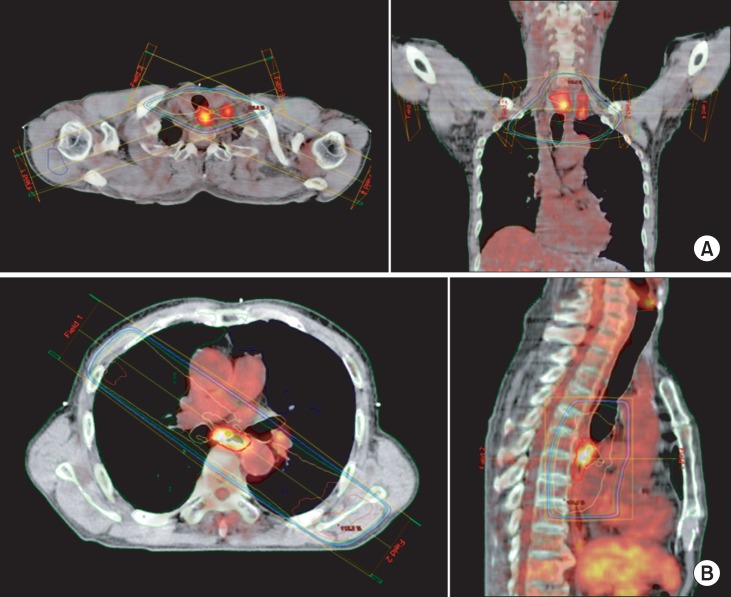
Treatment planning simulated with positron emission tomography/computed tomography (PET/CT) for patient with esophageal carcinoma. (A) A cervical esophageal lesion treated using a four-field 3D-conformal radiotherapy plan following initial anterior-posterior/posterior-anterior (AP/PA) fields. (B) Right anterior oblique and left posterior oblique field used to spare the left ventricle and spinal cord following initial AP/PA fields for a middle esophageal lesion.
In one patient, PET/CT detected newly developed distant metastasis, which resulted in changes to the treatment aim (Fig. 3). In this male patient, life-threatening pulmonary thromboembolism developed during the treatment course. After commencing warfarin medication, the RT course of 60 Gy to the primary mass area was completed to relieve symptoms, such as dysphagia and odynophagia. However, post-RT, the pulmonary metastatic lesion became aggravated and palliative supportive care was undertaken.
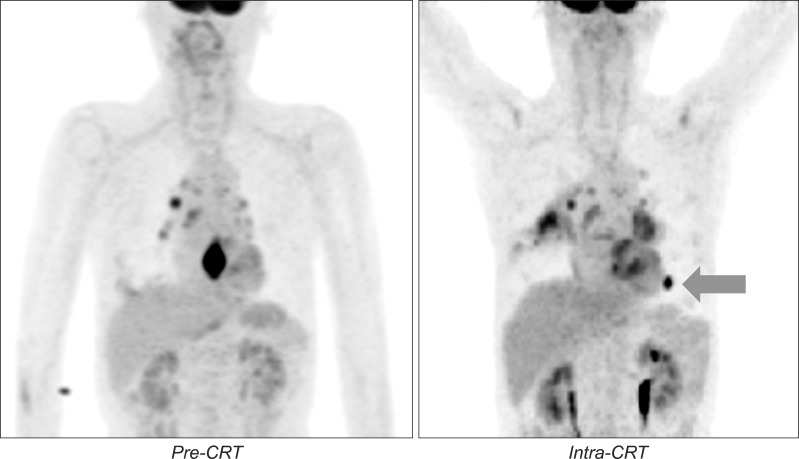
Example of newly developed metastatic lesion in left lung (arrow). The figures show maximum intensity projection positron emission tomography images pre-treatment (left) and intra-treatment (right). CRT, chemoradiotherapy.
In eight patients (24.2%), PET images showed diffuse FDG uptake in the irradiated esophageal region by intra-CRT PET. These diffuse FDG uptake of esophagus suggesting that esophagitis interfered with target volume delineation (Fig. 4).

Positron emission tomography images of a patient with esophagitis after 40 Gy of chemoradiotherapy (CRT). Images showed sagittal slices through the tumor at pre-treatment (left), intra-treatment (middle), and post-treatment (right). The intensity of 18F-fluorodeoxyglucose (FDG) uptake by esophagitis (arrow) is markedly lower than that by the initial tumor.
Three patients (9.1%) showed no demonstrable FDG uptake by PET before CRT, indicating a diagnostic sensitivity of 80% to 95% for PDG PET [3,18]. These undetected tumors were all of stage T1. Several studies have shown that T1a tumors are difficult to detect in submucosa by PET [18,19]. In these cases, PET did not provide any information and had no effect on RT planning, and thus, these PET-negative patients were excluded from the analysis of SUV, MTV, and TGA changes during CRT.
2. GTV delineation using conventional CT alone and PET/CT
CT-based and PET/CT-based GTVs were quantitatively compared using conformity indices (Table 3). Conformity index (CI) was defined as the intersection of two GTVs divided by the sum of them minus the intersection and was used to evaluate the spatial conformities of CT-based and PET/CT-based GTVs. A significant difference was found between CT- and PET/CT-based GTVs (relative difference 6.56% ± 17.43%, p = 0.032) (Table 3). Mean CI of GTVs was 0.7 (range, 0.26 to 0.905). In 18 patients (54.5%), PET/CT-based GTV were larger than CT-based GTVs by more than 105% (relative difference 18.45% ± 10.13%, p<0.001). In 8 patients (24.2%), the addition of PET scans led to a decrease in GTV of <95% (relative difference -15.7% ± 13.3%, p = 0.012). In some cases, PET/CT images detected areas of abnormal FDG uptake that were not evident by CT especially in the regional nodal area. The PET/CT scans also provided more information regarding for the differentiation of tumor-induced mucosal swelling and reactive lymphadenopathy due to metastatic disease.
3. Correlation of intra-CRT PET findings and clinical outcomes
At a median 4 months after CRT (range, 0 to 12 months), all 33 patients were evaluated for clinical responses and 23 patients underwent whole-body PET/CT scans for the evaluating of metabolic response. Regarding metabolic response of irradiated primary tumors and regional nodal regions after CRT, 7 of the 23 patients (30.4%) were classified as mCR and 16 (69.6%) as mPR. Finally, overall clinical outcomes were cCR in 8 patients (24.2%), cPR in 11 patients (33.3%), cSD in 5 patients (15.2%), and cPD in 9 patients (27.3%). In progression cases, 8 of the 9 patients had a newly developed distant metastases at out of RT fields.
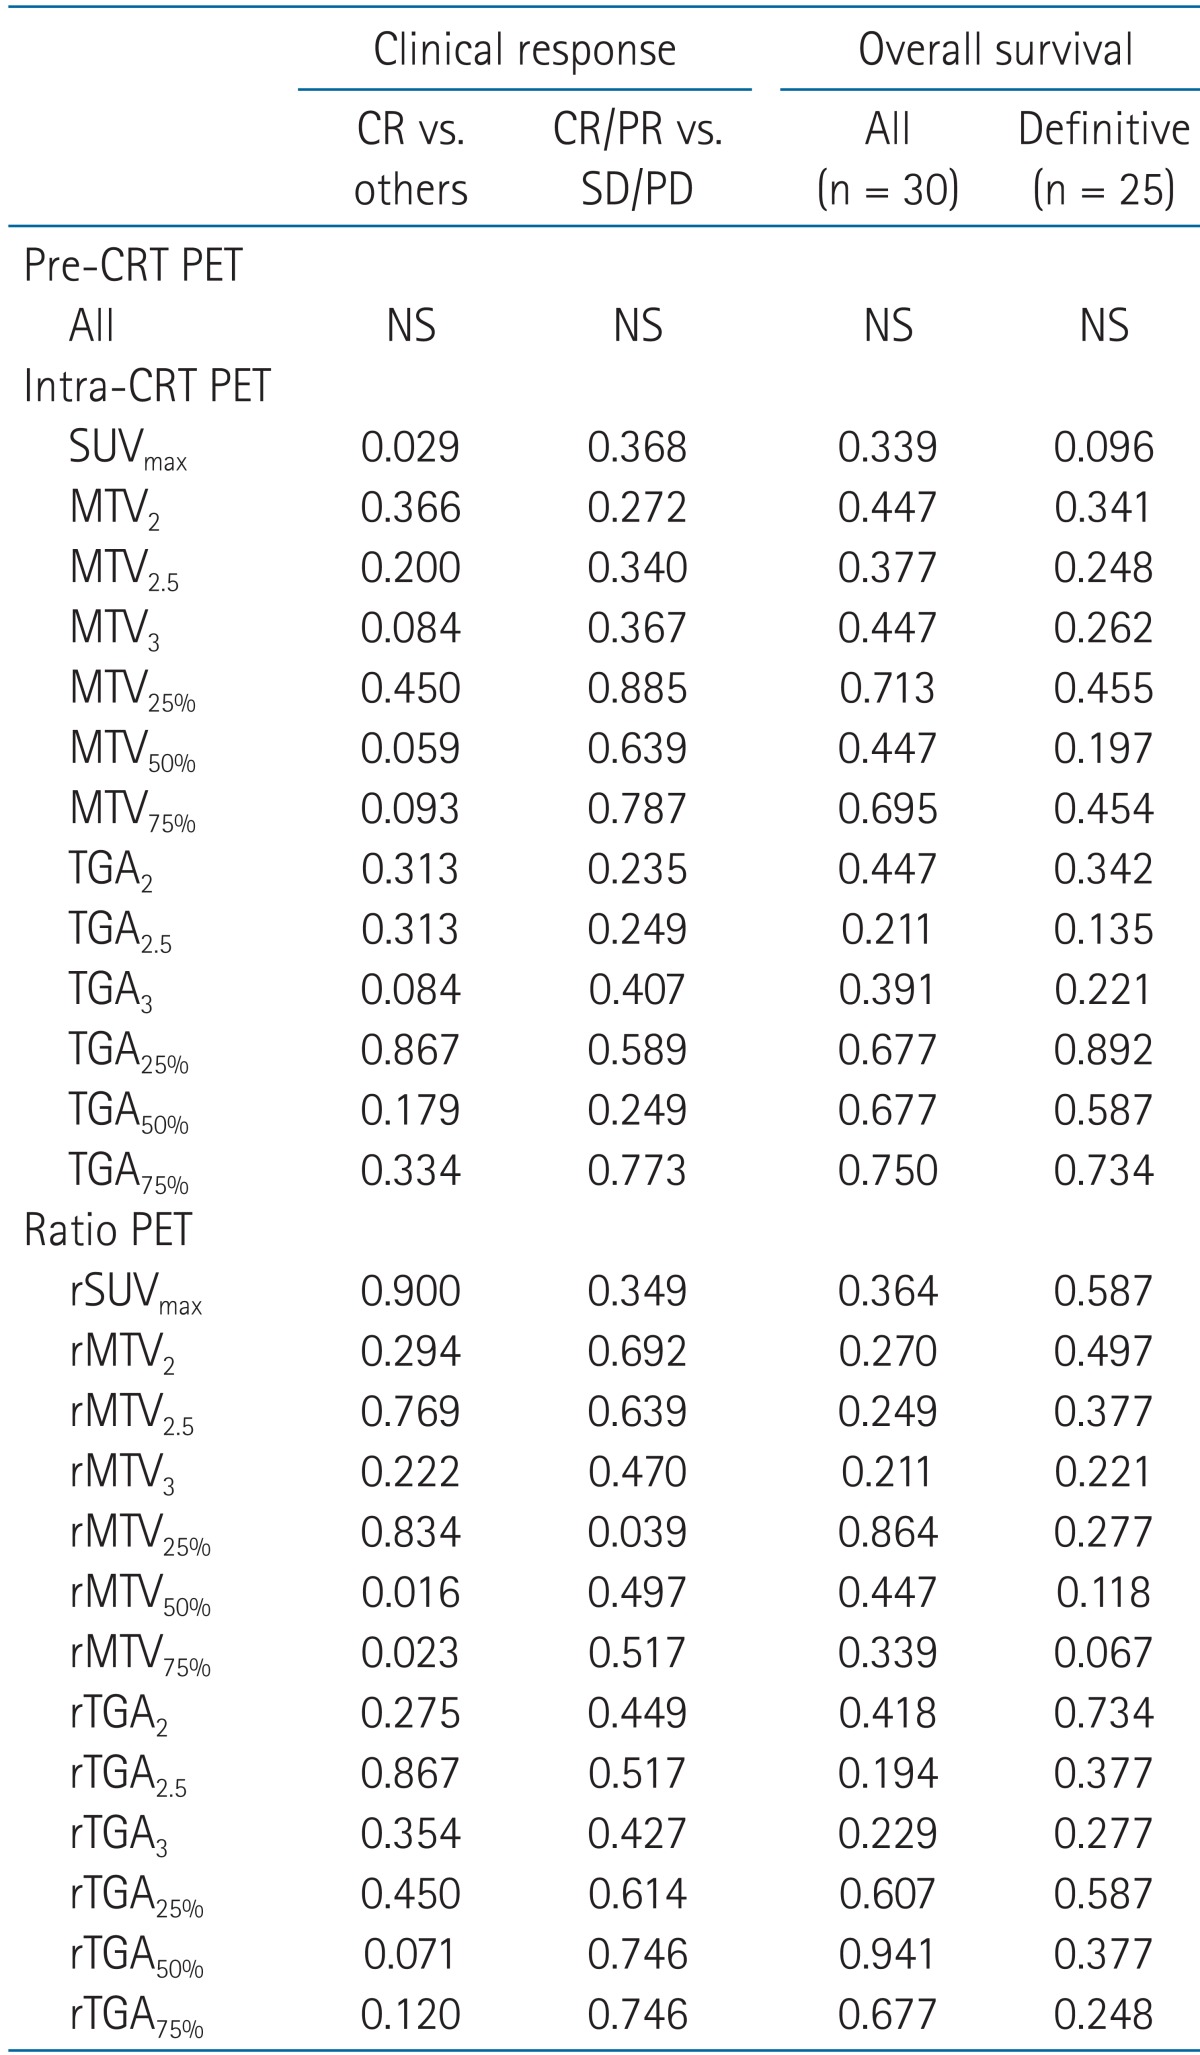
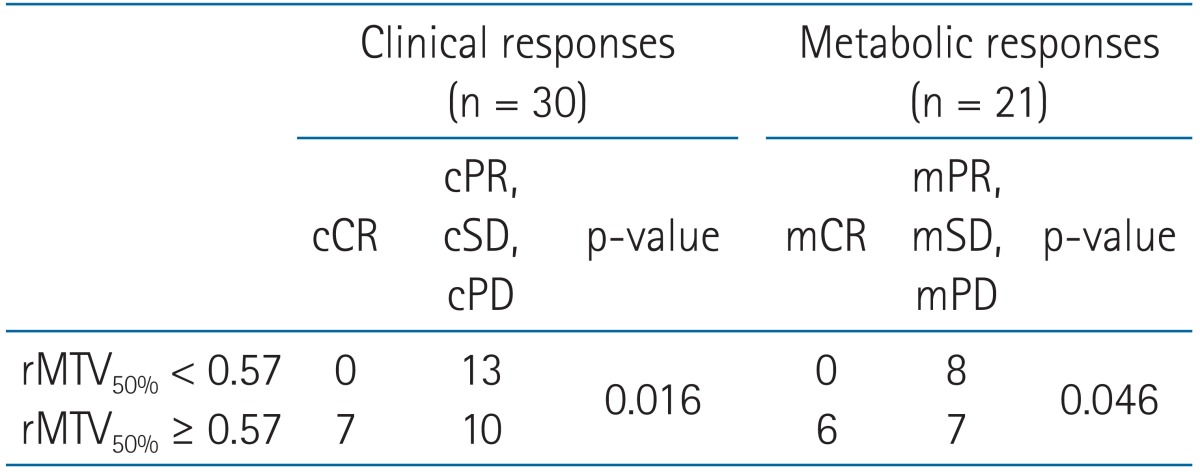
Median follow-up was 11 months (range, 3 to 17 months), and one-year overall survival rate was 78.8%. Relations between PET parameters and clinical outcomes post-CRT are listed in Table 4. No significant correlation was found between any of the pre-CRT PET parameters and clinical outcomes. In addition, several intra-CRT PET parameters were not correlated with clinical response or overall survival. However, SUVmax (p = 0.029), rMTV50% (p = 0.016), rMTV75% (p = 0.023) by intra-CRT PET ware found to correlated with cCR. Regarding changes in PET signals between pre-CRT to intra-CRT, rMTV50% (p = 0.016) showed the strongest correlation with cCR (Table 5).
When analysis of the correlation between MTV50% change and cCR was limited to the 30 patients with pre-CRT FDG-avid tumors, patients with a rMTV50% of <0.57 were found not to achieve cCR. When a rMTV50% of 0.57 was used as a cutoff, the sensitivity and specificity for the prediction of cCR were 100% and 57%, respectively, which was similar to the results of our metabolic response analysis (sensitivity 100% and specificity 50%, respectively).
Discussion and Conclusion
PET/CT is useful for the detection of esophageal cancer and locoregional lymph nodes, and has greater sensitivity and specificity than CT or PET alone. Because of its greater accuracy at differentiating malignant and normal tissues than morphologic imaging modalities, PET/CT can be incorporated into RT planning to improve target volume delineation and modulate treatment planning [7,20].
In esophageal cancer, the determination of cephalic and caudal tumor extent by CT is rather uncertain. Drudi et al. [21] found that the lengths of esophageal carcinoma measured by CT scan and esophagogram corresponded to the lengths of surgical specimens in only 32% and 59% of cases, respectively. Therefore, methods to increase the accuracy of target volume delineation are needed. Several previous studies have revealed that PET/CT could improve primary tumor and lymph node detection [18,22]. Furthermore, clinicopathological studies in patients treated surgically showed CT scanning is reasonably good at showing radial tumor extent but poor at assessing longitudinal extent, and that CT is often inaccurate when it is used to estimate the extent of nodal involvement [13]. PET is better than CT at showing the tumor longitudinal extent (Fig. 5). When an endoscope cannot be passed through a stenosed esophagus to visualize the lower boundary of a tumor, PET may be the only way to estimate the lower tumor border. Therefore, integrated PET/CT imaging aids the estimation of more accurate tumor volume and the distinction of precise anatomical barriers.

Visual interpretation for gross tumor volume delineation. Positron emission tomography/computed tomography (PET/CT) better depicted longitudinal tumor extent than CT. PET provided an accurate mean of delineating the lower tumor border (arrow).
In a prospective trial of PET for RT planning in esophageal cancer, Leong et al. [10] showed that PET has a significant impact on GTV and often helps avoid geographic misses by identifying unsuspected lymph node involvement. Moureau-Zabotto et al. [4] showed that the addition of PET information to CT-based RT planning altered GTV values in 19 of 34 patients (56%); GTV was reduced in 12 and increased in 7 (21%). In another study, Muijs et al. [23] reported that the additional use of PET led to the modification of CT-based RT planning in 57% of esophageal cancer patients. Furthermore, the authors demonstrated that the use of CT-based RT plans could result in underdosing in cases of PET-avid disease. Furthermore, they showed that PET significantly changed the radiation dose for organs at risk, such as the heart and lungs.
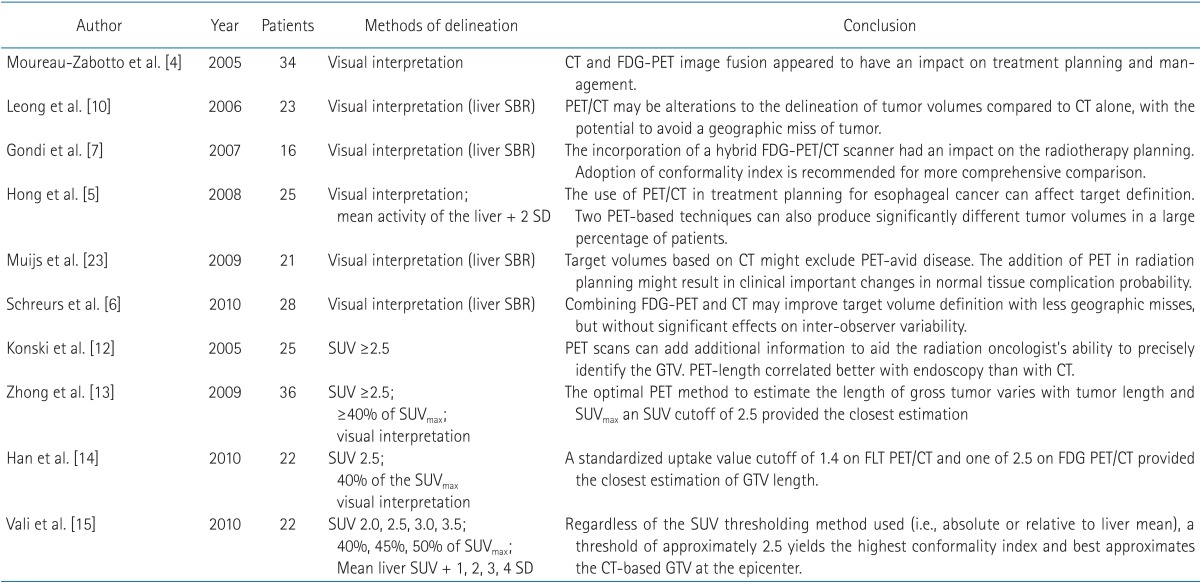
Guidelines for the appropriate delineation of target volumes on PET/CT images are being developed. However, several methods are currently used to delineate target volume: the visual interpretation method, the 40% or 50% of maximum SUV intensity method, and the SUV threshold method (Table 6). Similarly, as was done in the present study, the majority of authors have used the visual interpretation of PET images for GTV delineation [4,6,7,10,23]. They have used either a subjective manual approach or standardization of the liver background to window the signal followed by subjective interpretation of the FDG-avid area with no further windowing allowed. This latter approach is the source-to-background ratio method that requires the normalization of reference PET images versus physiological FDG uptake by liver to differentiate tumor and normal tissue [7]. Another delineation method is to define tumor with the 40% or 50% intensity level relative to the maximum SUV [13,24].
Konski et al. [12] used a SUV 2.5 to delineate tumor extension and evaluated CT-based tumor lengths in 25 esophageal cancer patients. Zhong et al. [13] compared PET-based tumor lengths with surgical specimens and showed that SUVmax, a SUV cutoff of 2.5 appeared optimal. Also, Han et al. [14] concluded that a SUV cutoff of 2.5 by PET/CT provided the closet estimation of GTV length. Vali et al. [15] compared 11 different methods: SUV ≥2.0, ≥2.5, ≥3.0, and ≥3.5; SUV values of ≥40%, ≥45%, and ≥50% of SUVmax; and mean liver SUV plus 1, 2, 3, and 4 standard deviations. The authors concluded that regardless of the SUV thresholding method used, the use of a threshold of approximately 2.5 was the best strategy for the delineation of GTV in esophageal cancer. Recent studies have shown SUV cutoff of 2.5 may be an optimal threshold for gross tumor delineation, however, it was added that auto-contouring using this threshold is problematic and should be avoided. Also residual uncertainty undoubtedly remains. Which of these is the optimal method has not yet been validated. Therefore, the lack of uniformity in the methods is a limitation of RT planning by integrated PET/CT. In the present study, GTV were determined by visual interpretation, but after 40 Gy of radiation various factors limited GTV delineation, such as radiation-induced esophagitis (Fig. 4) and reactive lymphadenopathy. Furthermore, the use of a specific SUV cutoff value was found to be unsuitable for intra-CRT boost planning.
Some authors have reported that metabolic response as determined by early repeated PET/CT is significantly correlated with pathologic and clinical outcomes during chemotherapy or CRT. In the MUNICON phase II trial, patients were divided into metabolic responder and non-responder groups based on metabolic response determined by PET at 14 days after the commencement of chemotherapy. Furthermore, members of these two groups were treated using different treatment protocols according to treatment response [17]. The authors confirmed prospectively the usefulness of early metabolic response evaluation and demonstrated the feasibility of a PET-guided treatment algorithm. Wieder et al. [25] reported that during preoperative CRT for esophageal cancer, changes in metabolic activity after 14 days of CRT predicted histopathologic tumor response and correlated significantly with patient survival. It was also concluded that PET might be used to identify non-responders early during neoadjuvant CRT.
Recent studies have shown that post-CRT PET predicts pathologic response and survival in patients with esophageal cancer. Roedl et al. [26] found a rMTV2.5 of <36% had a median overall survival of 34.1 months versus 21.8 months for a rMTV2.5 of ≥37%, and that MTV and TGA were good predictors of pathologic response and survival. Hyun et al. [27] reported that MTV was an independent predictor of overall survival (p=0.021). Jayachandran et al. [28] reported that MTV2.5, TGA2.5 and MTV2 ratio were useful markers for predicting the response and survival on the post-CRT PET scan, and suggested that PET could potentially be used to guide therapy after CRT.
In the present study, we sought to find relations between several parameters, such as, SUVmax, MTV and TGA as determined by PET/CT after 40 Gy of irradiation and clinical outcomes. We found SUVmax (p = 0.029), rMTV50% (p = 0.016), rMTV75% (p = 0.023) values as determined by intra-CRT PET correlated with cCR (Table 4). However, MTV and TGA by intra-CRT PET were not predictive of overall clinical response or overall survival, and clinical outcome and patient survival were not significantly different between responders and non-responders. Regarding, changes between pre-CRT and intra-CRT PET, rMTV50% (p = 0.016) was found to be most correlated with clinical complete response (Table 5). However, when our analysis of the correlation between MTV50% change and clinical complete response was limited to 30 patients with FDG-avid tumors before CRT, patients with a rMTV50% of <0.57 did not achieve cCR. Furthermore, this rMTV50% value during CRT was found to have a 100% non-cCR predictive value. In fact, the sensitivity and specificity of a rMTV50% of 0.57 were 100%, and 57% for cCR. Roedl et al. [26] showed that an rTGA2.5 (<22% or 22%) had a sensitivity of 91%, a specificity of 93%, and an accuracy of 92% for pathologic CR. The present study shows that rMTV50% (p = 0.016) during CRT was useful predictor of cCR, although the reason for this finding is not clear. The most commonly used PET parameter is SUVmax or MTV2.5. Our results show the use of one of these in isolation is inadequate for predicting clinical response during CRT, and suggested that rMTV50% provides a more accurate means of predicting total tumor activity and clinical response.
Our present study has several limitations. First, the sample size was limited to only 33 patients. Second, the study was inherently limited by its retrospective design, which introduced the potential for selection bias with respect to CT-based and PET/CT-based delineation. Furthermore, the chemotherapy regimens used varied. Third, follow-up was too short to explore relations between PET parameters and local control or survival. In addition, this lack of long-term observation might have contributed to the non-significant correlations between metabolic parameters and clinical outcome. Nevertheless, our study has clinical meaning as it presents the results of an analysis of the merits of PET/CT planning during CRT with respect to boost RT planning and response estimation during treatment.
To our knowledge, no previous study has been undertaken to investigate the relationship between PET/CT planning and clinical outcome, such as locoregional control or survival in esophageal cancer. It is unclear whether PET/CT planning can contribute to treatment outcome. Thus, further larger scale prospective studies are needed to evaluate whether the integration of PET/CT into radiotherapy planning for esophageal cancer dose influence outcomes.
In conclusion, PET/CT during CRT can provide additional information on radiotherapy planning in esophageal cancer due to its greater sensitivity, specificity and accuracy than CT. Our study demonstrates the merits of PET/CT for radiotherapy planning with respect to target volume delineation, and shows that PET/CT offers the possibility of tumor response evaluation during CRT. MTV50% ratio during CRT was found to be a useful marker for predicting clinical response after CRT, and SUVmax and MTV75% ratio, as determined by intra-treatment PET, were found to be correlated with clinical response. However, no study has yet demonstrated the use of FDG-PET/CT for radiotherapy planning in terms of improved locoregional control or survival. Additional study with a large number of patients is needed to evaluate the effect on treatment outcome.
Notes
No potential conflict of interest relevant to this article was reported.
