


Introduction
Chordomas are rare, slow-growing tumors characterized by a locally aggressive growth pattern [1]. The treatment of chordomas is challenging because they lie close to critical structures such as cranial nerves, the brain stem, and spinal cord and nerves. These anatomical locations make curative resection difficult, and the tumors often recur after surgery [2]. Therefore, post-operative radiotherapy is indicated in most cases [3-5]. Chordomas were previously considered radioresistant tumors, but we demonstrated that they are very radio-responsive in a previous study [6]. In the previous study, the tumor volume was measured before and after proton therapy (PT) by serial magnetic resonance imaging (MRI), and a radiographic volume response was found in most tumors. The median time to >50% reduction in the volume was 26 months. In addition, a dose-response relationship was observed: 90% of tumors were controlled in patients treated with 79 cobalt gray equivalents (CGEs, proton dose in Gy × 1.1), whereas only 50% were controlled in patients treated with 62 CGE. To improve local control, it is crucial to increase the total dose, while the dose to the surrounding critical organs is limited to the tolerance level.
In recent years, proton therapy (PT) has been widely adopted as a new modality of radiotherapy. The advantages of PT are that it delivers a high dose to the target and subsequently improves local control while sparing the surrounding normal tissues using its unique physical property of dose distribution with Bragg’s peak. Since March 2007, our institution has conducted PT for patients with cancers, including chordomas. We previously performed a prospective phase I–II dose escalation/feasibility study to determine the optimal hypofractionated dose/fractionation using PT; we found 69.6 CGE delivered in 29 fractions (75.2 Gy of EQD2 [equivalent dose delivered in 2 Gy fractions assuming an α/β ratio of 3 Gy]) to be optimal among the dose/fractionation levels used [6]. In the present study, we investigated the clinical outcome with a longer follow-up.
Materials and Methods
1. Patients
We retrospectively reviewed the medical records of 58 adult patients with chordomas who received definitive PT as the curative aim between June 2007 and December 2015 at the National Cancer Center, Korea. The eligibility criteria were as follows: biopsy-proven chordomas, postoperative microscopic, gross residual or recurrent tumor, no previous irradiation for the tumor in the same location, no distant metastasis, and an Eastern Cooperative Oncology Group performance status of 0–2. The median follow-up duration was 42.8 months (range, 4 to 174 months).
2. Proton therapy
Pre-treatment computed tomography (CT) and MRI for planning was available for all patients. Positron emission tomography (PET) was not routinely performed but was available for most patients. The gross tumor volume (GTV) was defined as the gross volume of all tumors detected on clinical and imaging studies, including CT, MRI and/or PET images. In postoperative cases, the clinical target volume (CTV) was delineated to include high-risk areas of subclinical disease, such as the surgical tumor bed and surgical entry region in the case of the trans-sphenoidal approach with 2- to 5-mm margins. The planning target volume (PTV) was expanded 2- to 10-mm margins from the GTV defined as PTV1 or CTV defined as PTV2 considering the set-up uncertainty and organs at risk (OAR). With heterogeneity correction, the dose was prescribed to the 100% isodose line, which encompasses at least 95% of the PTV. Patients were treated daily, five times per week, with one of the following doses for PTV1: 64.8 CGE/27 fractions, 69.6 CGE/29 fractions, 74.4 CGE/31 fractions, and 79.2 CGE/33 fractions (EQD2 assuming an α/β ratio of 3 Gy = 70.0–85.5 Gy). The corresponding doses for PTV2 were 54 CGE/27 fractions, 55.1 CGE/29 fractions, 55.8 CGE/31 fractions, and 56.1 CGE/33 fractions. In patients with tumor in close proximity with spinal cord or optic pathway, conventionally fractionated treatment of 70.0–76.0 CGE were delivered in 35–38 fractions with a daily dose of 2.0 CGE.
Dose constraints for OAR were as follows: the median dose was not allowed to exceed 54 CGE for the brain, brain stem, optic pathway, cochlea, and recto-sigmoid colon, and 45 CGE for the spinal cord and small intestine. Moreover, 1% of the volume was not allowed to exceed 60 CGE for the brain, brain stem, and cochlea; 58 CGE for the optic pathway; 54 CGE for the spinal cord and small intestine; and 70 CGE for the recto-sigmoid colon. The dose level that delivered the highest possible dose to the PTV such that the doses to the adjacent OARs were acceptable was chosen by evaluating the dosevolume histogram (DVH).
3. Follow-up
During PT, the patients were evaluated weekly to assess acute toxicities. After the completion of radiotherapy, the subsequent follow-up consisting of a history and physical examination with serial imaging studies (MRI) was performed every 3–6 months for 2 years and 6–12 months thereafter. We have not performed any imaging studies on regular basis to evaluate distant metastases. However, we conducted metastatic work-up, if patients had any symptoms or signs suggestive of metastases. Response criteria were as follows: complete response (CR), complete resolution; partial response (PR), a decrease of at least 50%; minimal response (MR), a decrease of at least 25% but less than 50%; progressive disease (PD), an increase of more than 25%; and stable disease (SD), neither a MR nor PD. We defined acute toxicities as adverse events occurring from the start day of radiotherapy to day 90 after the end of radiotherapy based on the Common Terminology Criteria for Adverse Events v3.0. Ninety days after the completion of treatment, all side effects were defined as late toxicities according to the Radiation Therapy Oncology Group/the European Organization for Research and Treatment of Cancer score.
4. Statistical analysis
The survival rates were calculated from the date of the start of PT. The survival curves of local progression-free survival (LPFS), distant metastasis-free survival (DMFS), overall survival (OS), and disease-specific survival (DSS) were calculated using the Kaplan–Meier estimates and were compared using the logrank test for univariate survival analysis. Multivariate analysis was conducted to evaluate variables affecting LPFS and DMFS by Cox proportional hazards analysis, but it was not useful because of the small sample size and number of events. All the test results were two sided, and a p-value less than 0.05 was deemed to indicate statistical significance. All statistical analyses were performed using SPSS version 20.0 (IBM, Armonk, NY, USA).
Results
1. Patient characteristics
Fifty-eight patients who underwent PT for chordoma were retrospectively analyzed. The clinical information and characteristics of the patients are summarized in Table 1. The median age was 54 years (range, 18 to 77 years). The tumors were located in the skull base in 34 patients (63.8%), in the cervical spine in 7 patients (12.1%) and in the sacrum in 17 patients (29.3%). The median initial tumor size was 4.1 cm in diameter (range, 1.0 to 16.0 cm). The maximum diameter of the initial tumor was less than 5 cm in 37 patients (63.8%) and >5 cm in 21 patients (36.2%). At the time of PT, 8 patients (13.8%) were treated for microscopic residual disease after gross total resection, and 50 patients (86.2%) were treated for gross disease after subtotal resection or biopsy only. The median total dose of PT was 69.6 CGE delivered in 2.4 CGE per fraction (range, 64.8 to 79.2 CGE), and the median EQD2 was 75.2 Gy (range, 70.0 to 85.5 Gy).
2. Survival outcomes and patterns of failure
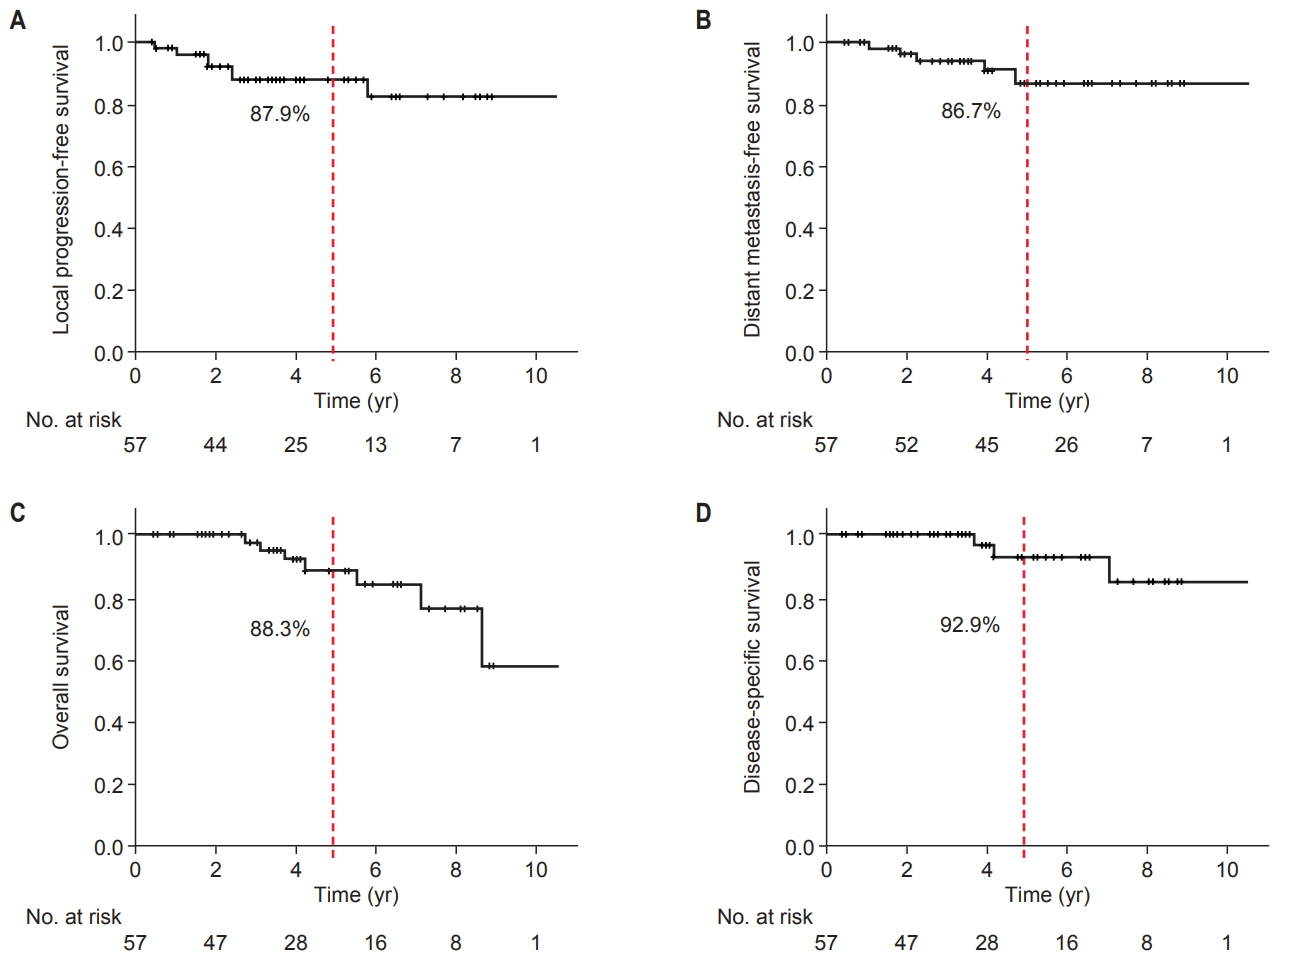
CT or MRI was performed to evaluate the tumor response every 3–6 months during the first 2 years and every 6–12 months thereafter. Bone scans or chest/abdomen/pelvis CT scans were performed when appropriate to rule out distant metastases. With a median follow-up of 42.8 months (range, 4 to 174 months), the 5-year LPFS, DMFS, and OS for all patients were 87.9%, 86.7%, and 88.3%, respectively (Fig. 1A–1C). At the time of analysis, 14 patients developed disease progression: 7 patients had local progression (Fig. S1–7), 3 patients had regional failure at lymph nodes or an adjacent primary tumor but outside of the treatment volume, and 5 patients who had a sacral origin developed distant metastases (2 had boneonly metastases, 1 had bone and liver metastases, and 2 had bone, lung and liver metastases), including one patient with local failure at the same time. Among 6 patients who were deceased, 3 died of progression of the chordomas, and the 5-year DSS was 92.9% (Fig. 1D).
3. Variables predicting local progression-free survival and distant metastases
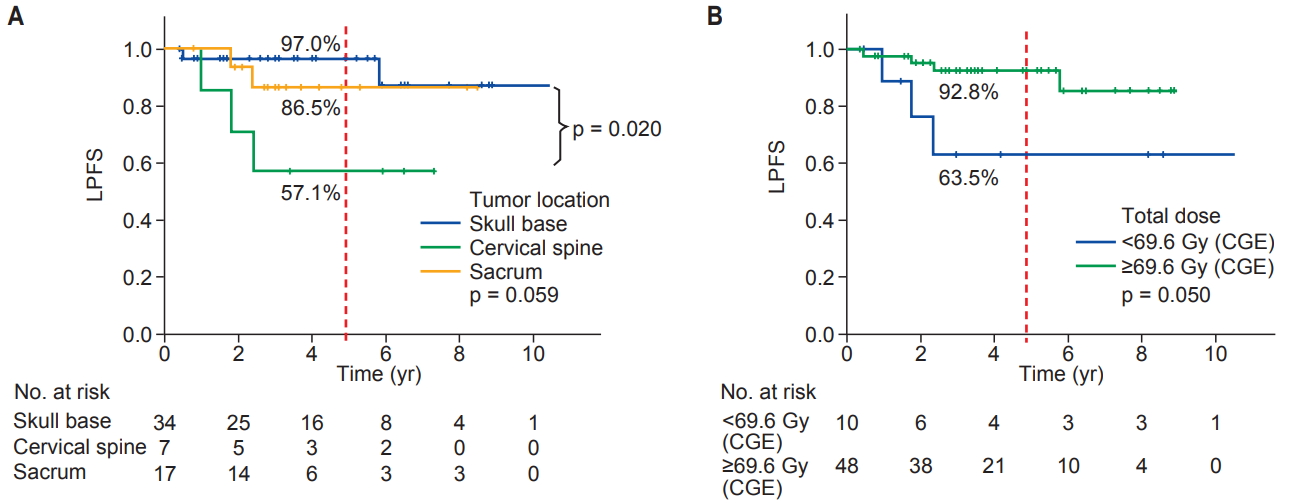
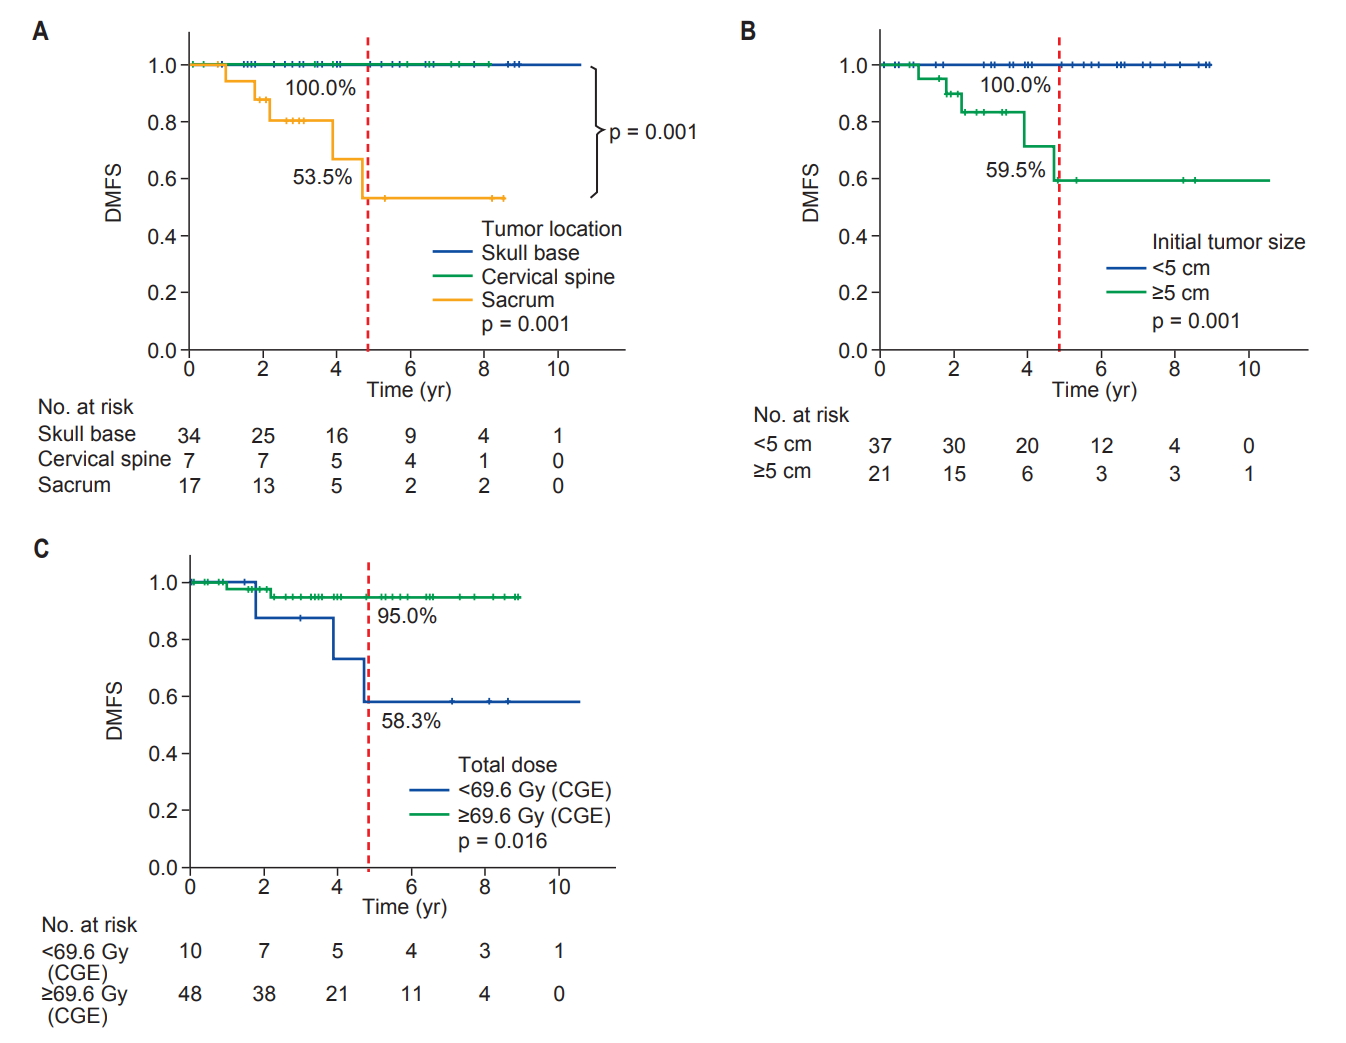
Univariate analyses of variables predicting LPFS and DMFS are shown in Table 2/Fig. 2 and Table 3/Fig. 3, respectively. In univariate analysis, the variables predicting LPFS were the tumor location and total dose delivered to the target. By contrast, the initial tumor size (<5 cm vs. ≥5 cm) or residual tumor (microscopic vs. gross) was not associated with the probability of LPFS (Table 2). The 5-year LPFS was 97% for the skull base, 57.1% for the cervical spine and 86.5% for sacrum tumors (skull base vs. cervical spine, p = 0.02; skull base vs. sacrum, p = 0.454; cervical spine vs. sacrum, p = 0.105) (Fig. 2A). The 5-year LPFS was 92.8% for patients treated with >69.6 CGE (75.2 Gy of EQD2) and 63.5% for those treated with <69.6 CGE (p = 0.050) (Fig. 2B). The variables predicting DMFS were the tumor location, initial tumor size >5 cm, and total dose delivered to the target, whereas the residual tumor volume (microscopic vs. gross) at the time of PT was not associated with it (Table 3). The 5-year DMFS was 97% for the skull base, 86.5% for the cervical spine, and 53.5% for sacral tumors (skull base vs. sacrum, p = 0.001; cervical spine vs. sacrum, p = 0.065) (Fig. 3A). The 5-year DMFS was 59.5% for patients with ≥5 cm of the initial tumor size compared with 100% for those with <5 cm (p = 0.001) (Fig. 3B). Interestingly, all patients who developed distant metastases had ≥5 cm of the initial tumor size in diameter (median tumor size for those who developed DM, 7.6 cm in diameter). Furthermore, patients who were treated with <69.6 CGE (75.2 Gy of EQD2) had a DMFS of 58.3%, which is lower than 95% of those treated with >69.6 CGE (p = 0.016) (Fig. 3C).
4. Adverse effects after PT
Acute toxicity was defined as the symptoms occurring from the PT start day to within 3 months from the end of PT. No patient had ≥3 grade acute toxicity, but approximately 70% of all patients experienced grade 1 to 2 acute toxicity of the skin and/or mucosa. Three patients had grade 3 late toxicity. One patient had only skin and subcutaneous toxicity. Another patient with a sacral tumor showed grade 3 late toxicity at the skin, rectal mucosa, and sacral plexopathy requiring rehabilitation for sacral nerve damage. The other patient with a skull base chordoma showed right-sided hemiparesis due to brain stem damage, requiring rehabilitation for hemiparesis.
Discussion and Conclusion
In our previous study [6], we demonstrated that chordomas are radio-responsive in a dose-dependent manner. In the present study, we reviewed the clinical outcomes of chordomas in patients treated with PT for chordomas in a larger cohort with a longer follow-up. Our data demonstrated an OS of 88.3%, an LPFS of 87.9%, a DMFS of 86.7%, and a DSS of 92.9% at 5 years. We observed that a high-target dose is critical to improve local control shown as 92.8% of LPFS in patients treated with >69.6 CGE (75.2 Gy of EQD2) compared with 63.5% of LPFS in those treated with <69.6 CGE at 5 years (p = 0.05). In the era of photon (X-ray) radiotherapy, conventional radiotherapy at doses of 40–60 Gy led to a poor outcome with only 23%–39% of the local control rate (LCR) at 5 years [7-9]. PT is beneficial for delivering a higher dose to the target using its physical property with Bragg’s peak. Hence, PT played an important role in improving local control while limiting the dose to surrounding OARs. Indelicato et al. [10] reported 88% of the 4-year LCR in which 26 primary chordomas were treated with median doses of 70.2–72.4 Gy of PT. Grosshans et al. [11] reported that the 5-year LCR for 10 skull base chordoma patients treated with a mean dose of 69.8 Gy of PT was 81%. In our study, the 5-year LPFS of 87.9% for all patients is similar to, if not better than, other reported outcomes using PT. The improvement in local control is attributed to high-precision PT that could escalate the dose to the target volume while sparing the surrounding critical normal tissues.
The location of the chordoma was associated with the pattern of failure. Patients with cervical chordoma showed the lowest LPFS compared with the non-cervical location (5-year LPFS: 57.1% for cervical vs. 93.1% for non-cervical tumors; p = 0.020). Yasuda et al. [12] analyzed 40 patients with skull base and cervical spine chordomas in which 75% of patients received adjuvant PT. In their study, the chordoma location at the cranio-cervical junction had a lower LCR than that at the skull base or other spine chordoma (5-year progressionfree survival rate: 40.9% vs. 90.0% vs. 83.3%, respectively; p = 0.007). Rotondo et al. [13] reported 68% of the 5-year LCR in which 127 patients with spine chordoma were treated with a mean dose of 72.4 Gy of PT. Stieb et al. [14] reported that 61% of the 5-year LCR in 76 patients with spinal chordoma or chondrosarcoma were treated with a median dose 73.9 Gy of PT. Our data also demonstrated the lowest LPFS rates in patients with cervical spine chordoma that could be attributed to the lower tolerance dose of the spinal cord. The chordomas of the cervical region close to the spinal cord make gross total resection difficult and, subsequently, leave gross residual tumors close to the spinal cord. Therefore, it is difficult to deliver the curative dose to the entire target without damaging the spinal cord; subsequently, we tend to have cold spots within the target adjacent to the spinal cord. When comparing median dose according to the location, the median total dose was lower for patients with cervical tumors than for those with tumors at other locations. Among patients with cervical chordoma, the median total dose of patients with local failure (EQD2 = 70.0 Gy) was lower than that without local failure (EQD2 = 75.2 Gy). In addition, analysis of the equivalent uniform dose (EUD) [15] for the cervical chordomas showed that mean EUD for cervical chordomas with local failure was 73.1 Gy of EQD2 (range, 70.2 to 77.1 Gy), which is lower than that for cervical chordomas without local failure (76.3 Gy of EQD2; range, 71.8 to 79.0 Gy). Terahara et al. [16] evaluated the relationship between the target volume coverage and local failure in 115 patients with skull base chordomas. In their experience, a lower EUD showed a significantly increasing probability of local failure. McDonald et al. [17] also noted the importance of the high-dose coverage of tumors in patients with skull base chordoma. They observed nine patients with local failure, and the median EUD and median dose received by 1 cm3 (D1cm3) of the GTV of the patients with local failure was lower than those of the patients without local failure (median EUD: 69.0 Gy vs. 74.7 Gy, p = 0.16; median D1cm3: 66.8 Gy vs. 76.3 Gy, p = 0.02). These analyses implied that the dose homogeneity as well as total dose is important for the local control of chordoma when treated with PT. To improve the dose homogeneity around critical organs such as the spinal cord, intensity-modulated PT (IMPT) using pencil beam scanning can be a solution. Grosshans et al. [11] compared treatment planning techniques between spot scanning PT and passive scattering PT for 10 chordomas and 5 chondrosarcomas of the skull base. The patients were treated with IMPT, with mean doses of 69.8 Gy for chordoma and 68.4 Gy for chondrosarcoma. They reported that, compared with the passive scattering plan, spot scanning plans demonstrated improved high-dose conformity and sparing of normal tissues. Although their median follow-up duration of 27 months was relatively short, IMPT was tolerable, and the disease control rates and toxicity were favorable. We anticipate that IMPT would improve LCR by increasing high-dose conformity, especially for cervical chordomas. Our institution has also used IMPT with pencil beam scanning since 2014 and we hope that this technique is shown to be useful in cervical chordomas.
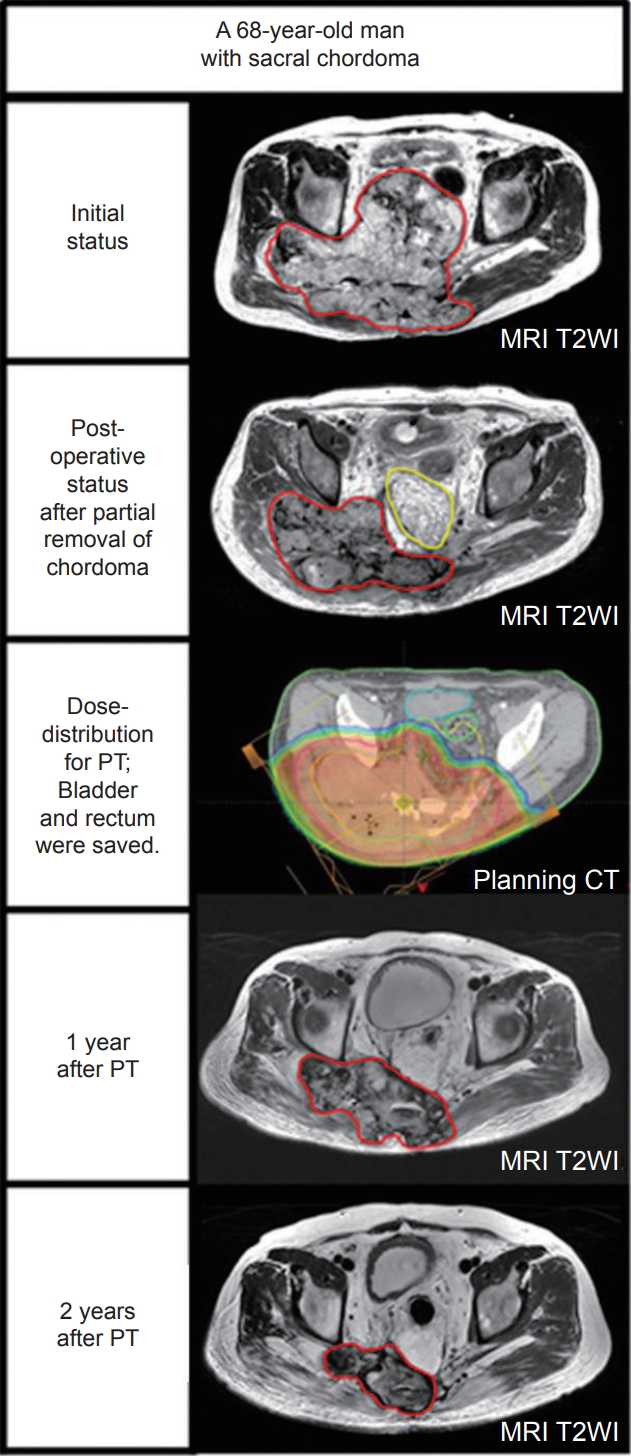
Another issue in local control is whether the tumor burden (gross vs. microscopic residual disease) at the time of PT affects the outcome. Staab et al. [18] reported 100% of the local control rate in 19 patients with extracranial chordoma treated with high-dose IMPT regardless of the presence of gross residual disease. However, they found a reduced local control rate in patients with titanium-based surgical stabilization resulting in a 5-year LCR of 30%. Our data also demonstrated that the 5-year LPFS was satisfactory regardless of the tumor burden because there was no difference between the groups (microscopic vs. gross: 83.3% vs 87.8%, respectively; p = 0.349), suggesting that there is no need for mutilating surgery with scarifying nerves for gross total resection (e.g., sacrectomy for sacral chordoma), and debulking or biopsy of the tumor for the diagnosis followed by IMPT may suffice in some cases. For instance, a 68-yearold man presented with pelvic pain, progressive difficulties with ambulation and urination over 2 years, and was found to have a >25-cm sacral chordoma involving the pelvic cavity and gluteal soft tissue. He was successfully treated with partial removal of the tumor followed by PT (Fig. 4). It has been the dogma not to truncate tumors, and en bloc resection should be performed when removing malignant tumors. However, en bloc resection is almost impossible in this case, and we decided to truncate the tumor at the junction between the pelvic cavity and gluteal soft tissue and removed a part of the tumor in the pelvic cavity with placement of the omentum as a spacer between the tumor bed and other pelvic organs (e.g., bladder and rectum). Following partial removal of the tumor, he was treated with 72 CGE in 30 fractions (77.8 Gy of EQD2) with a near complete response of the residual tumor with no serious bowel or bladder complication other than grade 2 skin toxicity. He enjoys his daily life with no evidence of recurrence or restriction of activity four years following the treatment. He has not had any problems with ambulation or bowel and bladder control, with an excellent functional outcome. As shown in this case, partial removal to obtain a sufficient space (or gap) between the critical organ and remaining tumor (placement of spacer, when appropriate) with functional preservation is a prerequisite to deliver a high dose of RT and is essential for a successful functional and oncologic outcome. Mutilating surgery with scarifying function such as sacrectomy should be avoided.
Our data suggest that the initial tumor bulk (maximum diameter >5 cm) at diagnosis was associated with the risk of distant metastases (DMs). DMs were observed in 5 patients who had sacral primaries. Radaelli et al. [19] analyzed 99 sacral chordoma patients who were surgically treated, and, among them, 19 patients received preoperative or postoperative photon radiotherapy and 28 patients were found to have DM; the 5-year crude cumulative incidence of DMs was 9%. In their analysis, larger tumors (≥9.5 cm in diameter) were prone to developing distant metastases. Sacral chordomas could be larger at diagnosis than skull base and cervical chordomas. Skull base or cervical spine chordomas can be detected earlier at a smaller size, whereas sacral chordomas tend to be discovered later in a larger size. In our study, the median initial size of the sacral tumors was 7.8 cm (range, 3.7 to 28.0 cm), which was larger than that for skull base tumors (median, 2.9 cm; range, 1.0 to 7.0 cm) or cervical spine tumors (median, 4.0 cm; range, 1.7 to 5.3 cm). It is unclear why total dose to the primary was associated with the risks of DMFS as shown as 58.3% of DMFS for patients receiving <69.6 CGE vs. 95% for those receiving >69.6 CGE (p = 0.016). The potential explanation may include that there were two patients with large sacral chordoma who had received a lower dose (<69.6 CGE) due to concerns of late bladder and rectum toxicity eventually developed local failure prior to DM. Their local failure could be attributed to the development of DM as a source of metastases.
Our clinical outcomes were a 5-year OS of 88.3% and a 5-year DSS of 92.9%. Compared with other similar studies, our survival outcomes were similar or slightly higher. Rotondo et al. [13] and Indelicato et al. [10] reported a 5-year OS rate of 82% and a 4-year OS rate of 83%, respectively. Even with dose escalation with a hypofractionation scheme, very little serious toxicity occurred in this study. Three patients developed five grade 3 late complications (one patient had skin, rectum and sacral nerve, one had skin, and one had brain stem complications). Two patients developed grade 3 skin toxicities and both of them treated with 69.6 CGE in 29 fractions (75.2 Gy of EQD2) for their sacral chordoma in a single posterior field. With this experience, we tried to use multiple fields to spread out the skin dose, and then no further grade 3 skin toxicities were observed. One patient had rectal complication which was self-limited, although he needed multiple transfusions for his anemia. The patient who developed aforementioned multiple sites of complications in the skin and rectum also suffered from late sacral plexopathy occurred 86 months after PT. He was the only one who had sacral nerve damage among 17 patients with sacral tumors and, therefore, we were not able to analyze the dose-response relationship for the sacral nerve damage. The other patient treated with 76 CGE in 38 fractions (76 Gy of EQD2) for her skull base chordoma, developed rightsided hemiparesis due to brain stem damage 24 months after PT. It was inevitable to avoid the brain stem from high dose irradiation because tumor invaded into the brain stem. The volume of the brain stem receiving >70 CGE (V70) was 7% on DVH. We always try to limit the dose and volume of irradiated brain stem as low as possible on planning, but they sometimes exceed the OAR constraints in cases of tumor invasion. For these cases, we try to limit V70 <3% based on our experience in which a few patients receiving V70 in the range of 2%–5% did not have serious brain stem complications.
In conclusion, PT is effective and safe in patients with chordomas. The tumor location was associated with the patterns of failure: local failure was common in cervical tumors, and distant failure was common in sacral tumors. Further refinement of PT, such as the use of intensity modulated PT for cervical tumors, is warranted to improve the outcome.