


Introduction
In the treatment of extremity soft tissue sarcomas, use of radiation therapy (RT) in addition to limb-sparing surgical resection increases local tumor control (LC) by 20% to 25% compared to limb-sparing surgery alone [1,2]. Furthermore, LC rates following combined RT and limb-sparing surgery are as high as 90% [3], matching the highest rates of LC achieved with radical resection [4]. Thus, RT is a valuable tool for reducing the morbidity of treatment while attaining excellent LC. RT may also confer a small survival benefit [5], though this has not been confirmed by prospective studies. Compared to post-operative RT, pre-operative RT provides similar LC but reduced risk of late and potentially irreversible complications, such as high-grade fibrosis [6].
Although large retrospective studies have established that larger tumor size prior to treatment is associated with higher risk of distant recurrence and mortality [7,8], it is unclear whether changes in tumor size during the course of RT are of similar significance. Recent studies have examined changes in tumor size by assessing images obtained before and after RT, finding relationships to histologic subtype and histologic evidence of treatment effect following surgical resection [9-12]. However, several important questions remain unanswered. As prior studies assessed the overall change in tumor volume based only on measurements before and after RT, it is not known whether tumors exhibit more complex and heterogeneous patterns of change during treatment, which may impact dynamic or adaptive planning. Furthermore, it is unclear whether radiographic tumor response during RT directly correlates to clinical outcomes.
Thus, goals of this study were to (1) characterize the patterns of volume change of extremity and pelvis soft tissue sarcomas during RT, (2) identify predictors of volume change during RT, and (3) determine whether volume changes predict histologic treatment response or clinical outcome.
Materials and Methods
This was a Johns Hopkins Medicine Institutional Review Board approved study (IRB00094531) evaluating 33 patients treated at our institution between 2013 and 2016. Patients with soft tissue sarcomas of the pelvis or extremity treated with intensity-modulated RT (IMRT) or three-dimensional conformal RT (3D-CRT) prior to definitive wide excision (limbsparing or amputation) were included if cone-beam computed tomography (CBCT) imaging was obtained during RT. Cases were excluded if prior resection resulted in residual tumor that was no longer identifiable on imaging, or if treatment was performed without curative intent.
The gross tumor volume (GTV) and clinical target volume (CTV) were defined according to the RTOG Extremity Soft Tissue Sarcoma Atlas [13]. The GTV was identified and delineated on co-registered CT and gadolinium-enhanced T1 magnetic resonance images. The CTV typically comprised a 3-cm expansion of the GTV in the proximal and distal directions and a 1.5-cm radial expansion, or up to a tissue plane. Per institutional standard, the planning target volume (PTV) was defined as a uniform 5 mm expansion.
Tumor volumes during RT were measured using CBCT series taken immediately prior to the delivery of each radiation dose. CBCT series were imported into a RT planning software, in which the tumor volumes were contoured and its volume measured. For each patient, CBCT series from every 5th day of treatment and the final day of treatment were evaluated. For example, if a patient received 20 fractions over 20 days, CBCT series obtained immediately prior to the delivery of the 1st, 6th, 11th, 16th, and 20th fractions were evaluated. If a CBCT series was not available for a given day of treatment, imaging obtained on the following day of treatment was evaluated instead. Proportional tumor volumes were calculated by dividing all tumor volumes by the initial tumor volume, measured using the CBCT series obtained immediately prior to the delivery of the first fraction.
Patient and treatment characteristics were obtained from chart review. The surgical specimen was used to determine the histologic subtype of sarcoma and FNCLCC grade, except in cases of insufficient remaining viable tumor, in which the initial core needle biopsy was used instead. Grade was dichotomized based on the Union for International Cancer Control (UICC) TNM recommendations, by which FNCLCC grade 1 is considered low-grade and FNCLCC grades 2 and 3 are considered high-grade [14]. The surgical specimen was used to identify histologic outcomes of treatment, including resection margin status and remaining percentage of viable tumor following neoadjuvant therapy. Time to local recurrence, distant recurrence, and all-cause mortality was measured from the date of resection. Local recurrence was defined as tumor recurrence in the same limb or hemipelvis.
Statistical analyses were performed to characterize the change in tumor volume over the course of RT, identify predictors of change in tumor volume, and assess whether changes in tumor volume predict histologic findings and tumor recurrence. Change in tumor volume during RT was assessed using two measures: (1) change in proportional tumor volume and (2) rate of change in proportional tumor volume, estimated using linear regression. The linearity of volume changes was evaluated using the R2 and p-value of linear regression. Potential predictors of both measures of change in tumor volume were evaluated using the Kruskal-Wallis test or Mann-Whitney U test for categorical factors and linear regression for continuous factors. Both measures of change in tumor volume were assessed as potential predictors of resection margin status, histologic treatment response, and tumor recurrence, using logistic, linear, and Cox regression, respectively. Statistical analyses were performed in R version 3.4.4 (https://www.R-project.org).
Results
Chart review identified 33 patients with extremity or pelvis soft tissue sarcomas treated with RT followed by definitive wide excision who had CBCT imaging throughout RT. Patient and treatment characteristics are shown in Table 1. Twenty-nine patients (88%) had high-grade tumors, and 29 tumors (88%) were primary. The most common histologic subtypes were high-grade undifferentiated pleomorphic sarcoma (n = 11, 33%) and myxoid liposarcoma (n = 5, 15%). Planned radiation schedules comprised a median of 5,000 cGy (range, 4,400 to 5,040 cGy) delivered in fractions of 200 cGy (n = 28, 85%) or 180 cGy (n = 5, 15%). Two patients concluded RT prematurely, after receiving 3,600 and 2,000 cGy. Due to close resection margins, one patient received an additional boost of 2,200 cGy in 11 fractions approximately 3 months after the end of their initial course of RT. Fourteen patients (42%) received chemotherapy for treatment of their sarcoma. Timing of chemotherapy with respect to RT was interdigitated in 8 (24%), sequential in 4 (12%), and concurrent in 2 (6%) patients.
Five patients (15%) were previously diagnosed with sarcoma. In two cases, the index lesion was a local recurrence of a previously treated lesion in the same hemipelvis or extremity. In two cases, the index location was a metastasis from the retroperitoneal space. In one case, the index lesion was a malignant peripheral nerve sheath tumor (MPNST) in a patient with neurofibromatosis type 1 (NF1) in whom two prior lesions were identified as MPNST. Additionally, three patients had prior cancer diagnoses unrelated to their sarcoma, including basal cell carcinoma, colorectal carcinoma, and multiple myeloma, all of which were in remission by the time that the index lesion was treated.
Four patients (12%) received RT prior to the treatment of their index lesion. One patient received intra-operative RT (12 Gy) for primary leiomyosarcoma of the kidney. The patient with NF1 and prior MPNST received two prior courses of radiation for lesions distant to the index lesion. The two patients with prior multiple melanoma and colorectal carcinoma also received prior RT to locations distant to the index lesion.
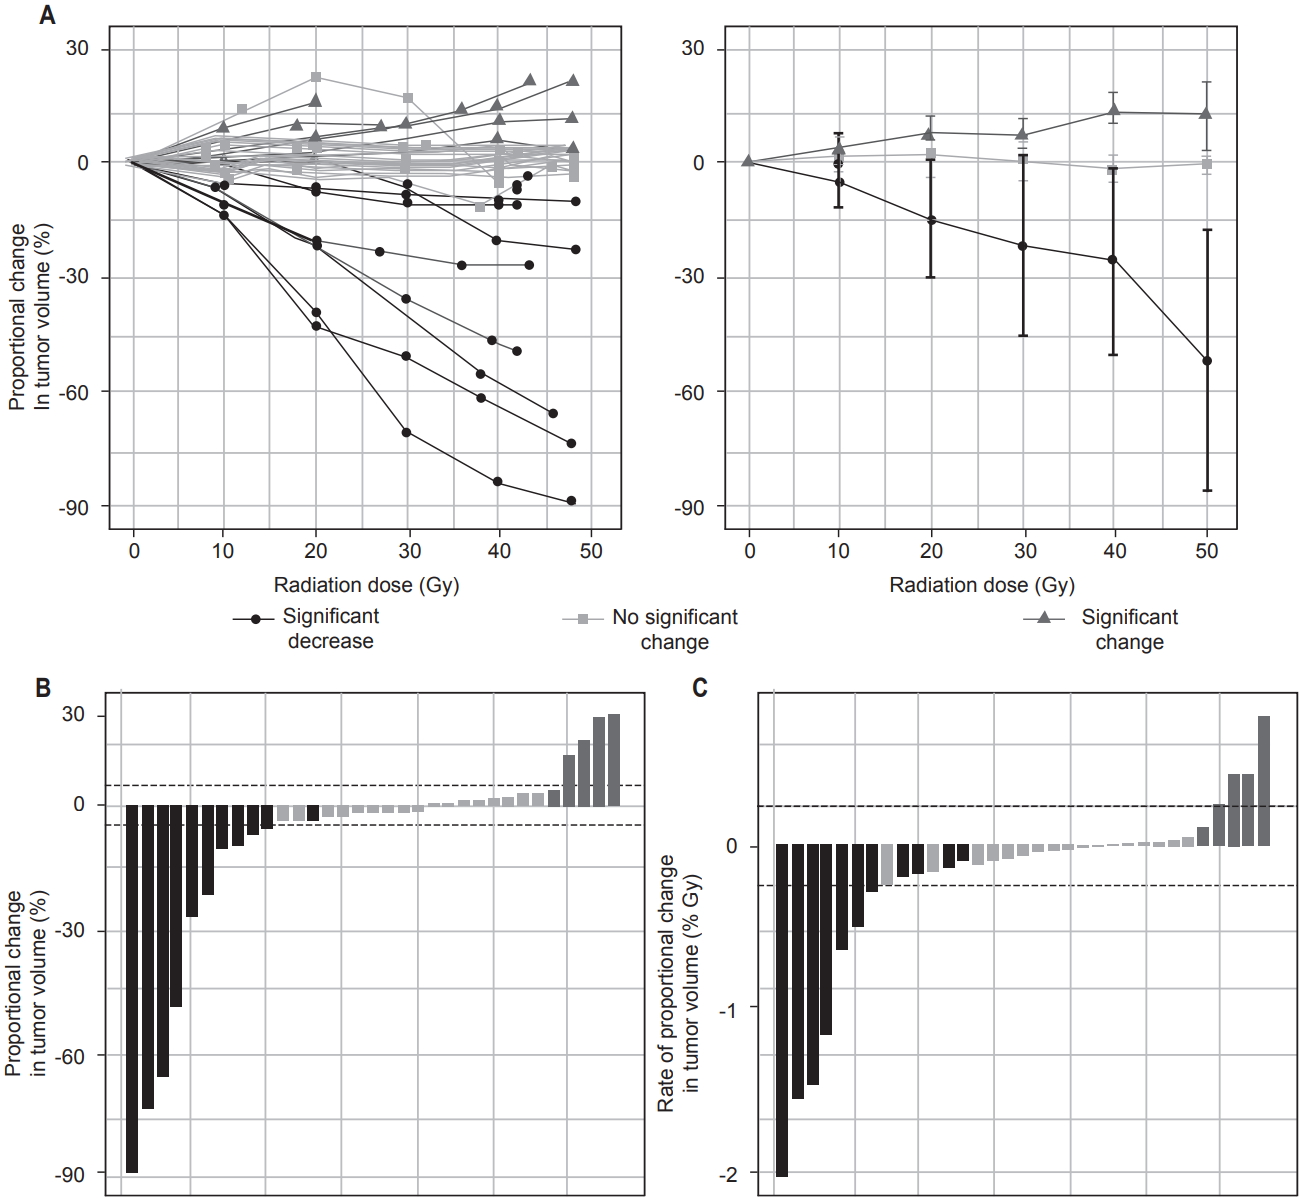
Mean tumor volume immediately prior to the first fractional dose varied widely, from 7.2 to 4,885 mL (median, 189 mL). Proportional change in tumor volume ranged from -89% to +22% (median, -2%), and rate of proportional change in tumor volume ranged from -2%/Gy to +0.8%/Gy (median, -0.06%/Gy). Linear regression showed that 16 tumors (48%) demonstrated significant volume changes during RT (p < 0.05). Of these, 5 tumors (15%) increased in volume and 11 (33%) decreased in volume, whereas the remaining 17 cases (52%) showed neither a significant linear increase nor a significant linear decrease in volume.
Over the course of RT, tumor volumes tended to evolve in linear trends (Fig. 1A). Of 14 cases in which the tumor volume increased or decreased by more than 5%, all 14 cases showed statistically significant linear trends (p ≤ 0.04), and the median R2 among these was 0.96 (Fig. 1B). Of 11 cases in which the rate of proportional change in tumor volume was either greater than +0.25%/Gy or less than -0.25%/Gy, all 11 cases showed statistically significant linear trends (p ≤ 0.05), and the median R2 was 0.97 (Fig. 1C).
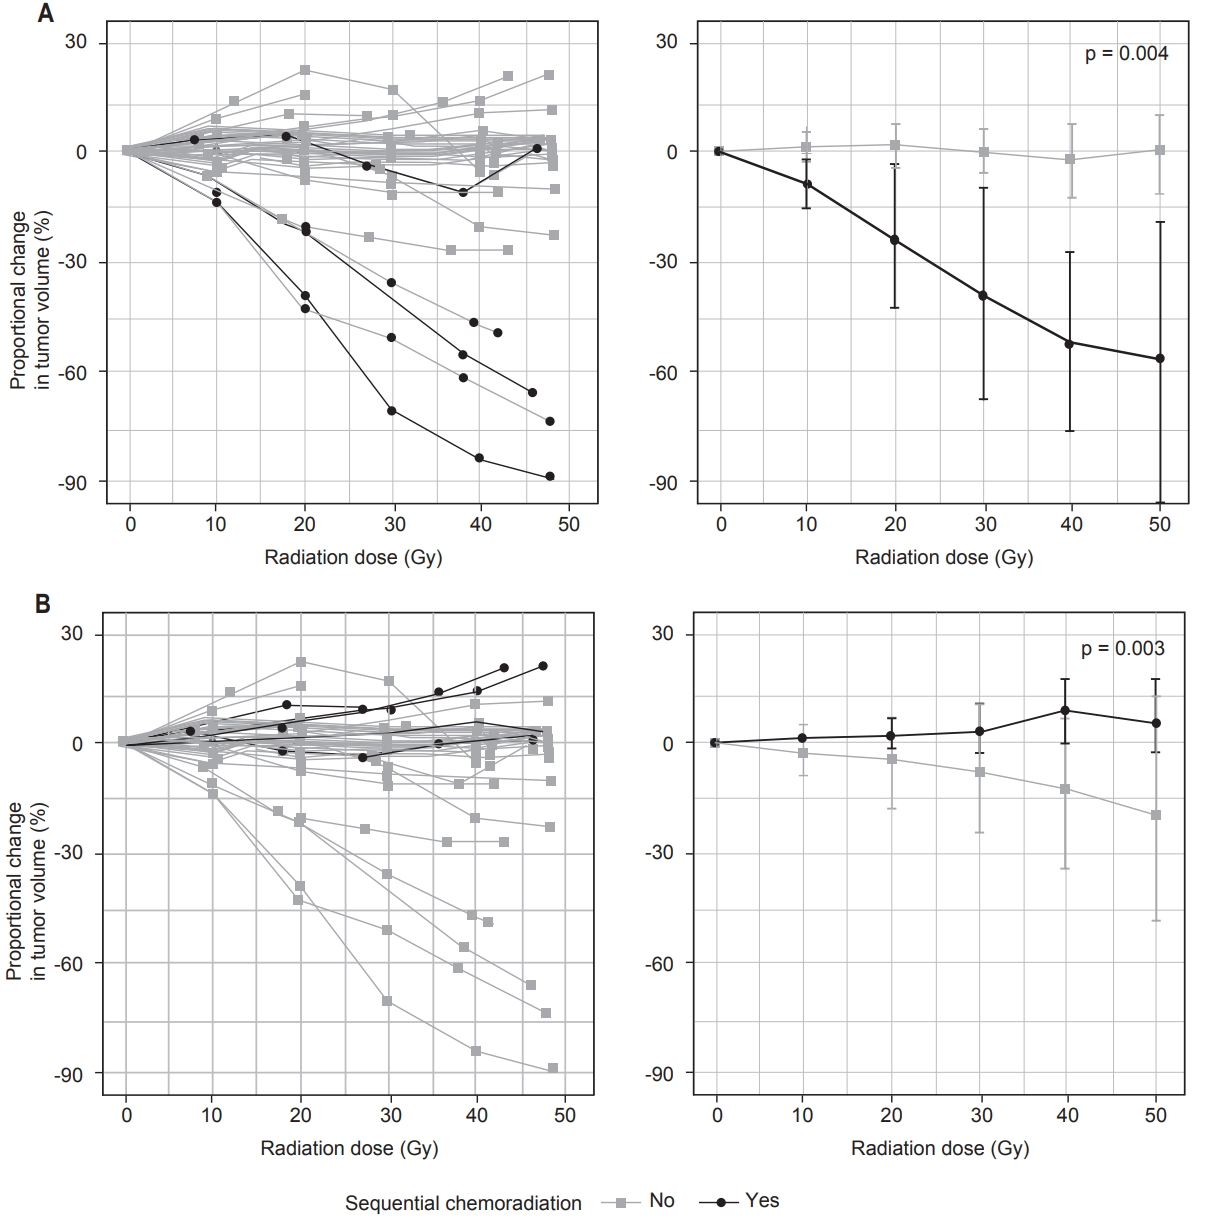
Myxoid liposarcomas tended to reduce in volume during RT (Table 2, Fig. 2A). Compared to other histologic subtypes, myxoid liposarcomas demonstrated greater proportional decrease in volume by the end of RT (p = 0.004) and faster rates of proportional volume loss during RT (p = 0.0002). Of 5 cases of myxoid liposarcoma, linear regression identified a significant linear decrease in volume over the course of RT in 4 cases (p ≤ 0.0006), while 1 case showed neither a significant linear increase nor a significant linear decrease (p = 0.3).
Sequential timing of chemotherapy and RT was associated with greater increase in tumor volume during RT (Table 2, Fig. 2B). Compared to other patients treated with interdigitated or concurrent chemoradiation, patients who received sequential chemoradiation demonstrated greater proportional increase in tumor volume by the end of RT (p = 0.008) and faster rates of proportional volume increase during RT (p = 0.004). Similar findings were observed when comparing patients who received sequential chemoradiation to the remainder of the entire cohort (Table 2).
Patients who received sequential chemoradiation also had longer times from the first image-based or histologic diagnosis of sarcoma to the start of RT, compared to other patients who received chemotherapy (median 109 vs. 59 days, p = 0.01) or the remainder of the entire cohort (median 109 vs. 61 days, p = 0.04). However, within the overall cohort, the time from diagnosis to the start of RT was not related to proportional change in tumor volume (p = 0.7) or rate of proportional change (p = 0.8).
The fraction of remaining viable tumor within the resected specimen ranged widely, from 0% to 100% (median 10%), and was not significantly related to proportional change in tumor volume (p = 0.6) or rate of proportional change in tumor volume (p = 0.6). Resection margins were histologically positive in 3 cases (9%). Two of these patients continued receiving the same systemic regimens that they had been receiving prior to surgery. One patient received doxorubicin, ifosfamide and mesna, and the other patient received pazopanib on a clinical trial. The third patient with a positive resection margin did not receive systemic therapy either before or after resection. None of these three patients experienced local or distant tumor recurrence at last follow-up. Univariate logistic regression showed that positive margin status was associated with MPNST versus other histologic subtypes (p = 0.02) but no other factors. When controlling for MPNST versus other histologic subtypes, margin status was not related to proportional change in tumor volume (odds ratio [OR] = 1.002/%, 95% confidence interval [CI], 0.941 to 1.14) or rate of proportional change in tumor volume (OR = 0.986/(0.1%/Gy), 95% CI, 0.753 to 1.54).
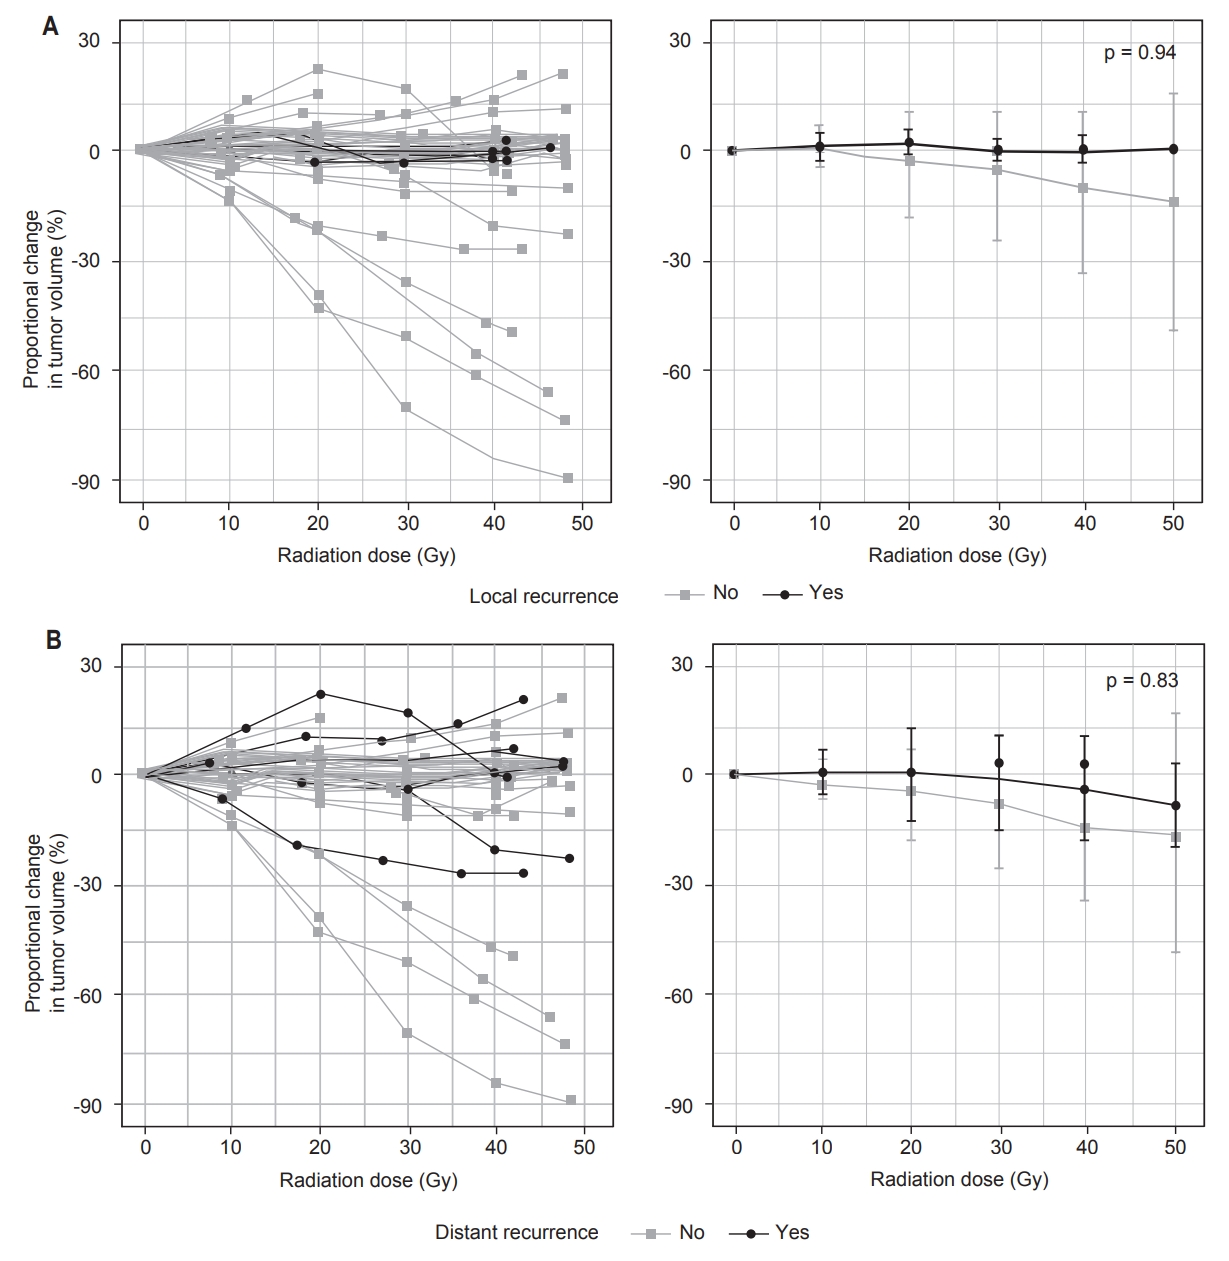
Median follow-up time after surgery was 2.3 years (range, 3.4 months to 4.9 years). Five patients (15%) experienced local recurrence (Fig. 3A) and 7 (21%) experienced distant recurrence (Fig. 3B), at median 8.9 and 6.9 months postresection, respectively. Three of five cases of local recurrence occurred in patients who also developed distant recurrence. Two patients had uncontrolled metastatic disease at the time of treatment of their sarcoma and were therefore excluded from analyses of distant progression. Univariate Cox regression showed that larger tumor volume prior to RT predicted greater risk of local recurrence (p = 0.034) and distant recurrence (p = 0.048) (Table 3).
When controlling for tumor volume prior to RT, multivariate Cox regression showed that proportional change in tumor volume during RT, rate of proportional change in tumor volume during RT, and fraction of remaining viable tumor each did not predict local recurrence or distant recurrence (p ≥ 0.5) (Table 3). As only two patients were deceased at follow-up, all-cause mortality could not be correlated to change in tumor volume or fraction of remaining viable tumor.
Discussion and Conclusion
In the treatment of soft tissue sarcomas with RT, larger tumor size prior to treatment is associated with poorer overall survival [7,8]. However, sarcomas have also been observed to undergo marked changes in volume during RT [9-12], the clinical significance of which is not well understood. Thus, the goals of this study were to (1) characterize the patterns of volume change of pelvis and extremity soft tissue sarcomas during RT, (2) identify predictors of volume change, and (3) determine whether volume changes predict histologic treatment response and tumor recurrence.
Prior retrospective studies have attempted to characterize changes in the size of sarcomas during RT. However, the frequencies at which tumors increase, decrease, or remain stable in size differ conspicuously among studies. Defining regression as ≥50% volumetric decrease and progression as ≥25% volumetric increase by the end of RT, Roberge et al. [9] reported 20% regression, 26% progression, and 54% stasis among 50 soft tissue sarcomas. Applying the RECIST criteria [15], Canter et al. [10] observed 20% progression and 80% stasis among 25 cases; and le Grange et al. [11] observed 89% stasis, 7% partial response, and 4% progression among 68 cases. The current study reports 15% progression, 33% regression, and 52% stasis among 33 cases, based on whether tumor volumes measured during RT followed significant linear trends. Heterogeneous tumor and treatment characteristics notwithstanding, it is likely that the different methods of assessing radiographic change contributed to the differences in observations.
The current study employs a more rigorous method of quantifying changes in tumor size, compared to prior efforts. Roberge et al. [9], Canter et al. [10] , and le Grange et al. [11] evaluated volume change based on only two time points, before and after RT. Tumor volumes in the current study were assessed based on multiple image series obtained daily during RT. This methodology allows not only an evaluation of the overall change in volume but also a finer understanding of the patterns of change throughout the course of RT, which has been absent from the literature on soft tissue sarcomas and has significant implications for the use of adaptive radiotherapy planning. Tumor volumes tended to evolve in a simple, predictable, linear pattern over the course of RT, which is particularly obvious in the cases that showed the largest changes in volume (Fig. 1A). This observation supports consideration of adaptive planning for patients whose tumors demonstrate either an increase or decrease in tumor volume across the radiation treatment course.
Despite various methods of measuring radiographic change, there is some consensus that myxoid liposarcomas demonstrate radiographic regression during RT. Roberge et al. [9] described a median decrease in tumor volume of 82.1% among myxoid liposarcomas versus 13.8% among nonmyxoid low-grade sarcomas (p < 0.001). Le Grange et al. [11] also found a median 64.2% decrease in tumor volume among myxoid liposarcomas. Similarly, this study reports a median 66% decrease in tumor volume among myxoid liposarcomas versus 2% among other histologic subtypes (p < 0.006). In contrast to previous studies, we also found that sequential chemoradiation predicted radiographic enlargement of tumor volume during RT. Sequential chemoradiation was also related to longer times between the initial diagnosis and the start of RT, which suggests that the timing of treatment plays a role in whether radiographic increase in tumor volume is observed.
Previous studies have not reached consensus regarding the relationship between radiographic changes during RT and histologic treatment response at the time of surgical resection. Defining histologic response as total absence of tumor cells combined with at least one other characteristic finding, Roberge et al. [9] found that radiographic regression strongly predicted histologic response (p < 0.001). However, Canter et al. [10] and Stacchiotti et al. [16] observed that RECIST response was poorly related to histologic response. Furthermore, the current analysis found no correlation between change in tumor volume and extent of viable tumor on histologic analysis of the resection specimen. In contrast to the lack of consensus regarding histologic response, Roberge et al. [9] and Canter et al. [10], as well as the current study, all observed that radiographic changes in tumor size during RT did not predict surgical margin status.
From a clinical perspective, it is unclear whether histologic features of treatment response correspond closely to patient outcomes. Although some studies observed higher rates of disease-free survival in patients with nearly complete histologic response [17,18], similar studies found that thresholds of 80% [19,20] and 95% [21] tumor necrosis did not predict distant control following resection. Similarly, our current study did not find a significant relationship between extent of viable tumor seen after surgical resection and the frequency of local or distant recurrence. Schaefer et al. [12] presented a more complex picture, finding that hyalinization or fibrosis predicted overall and recurrence-free survival, but remaining viable tumor did not.
Unlike previous studies, our work directly assesses the relationship between radiographic change in tumor volume during RT and patient outcomes, including local and distant recurrence. Cox regression showed that neither proportional change in tumor volume nor rate of proportional change during RT predicted tumor recurrence. We acknowledge that this negative finding is limited by the small sample size of this study, but note that the predictive value of tumor size prior to RT was detectable even in this cohort. In the absence of more robust evidence, our findings suggest that the volumetric progression or regression of extremity and pelvis soft tissue sarcomas should not be considered as indicative of patient outcomes following treatment.
In conclusion, this work enhances our understanding of radiographic volume changes of extremity soft tissue sarcomas during RT. Generally, tumor volumes appear to evolve in simple, linear patterns during the course of RT. This suggests that adaptive planning may benefit patients by accounting for tumor volume change across a multi-week radiation treatment course, and that the presence or absence of radiographic changes may inform the decision of whether to pursue adaptive planning. Our findings also suggest that volume changes reflect histologic subtype and treatment characteristics but do not predict resection margin status, histologic response to treatment, or recurrence after resection.