 |
 |
AbstractPurposeThe integration of large-scale gene data and their functional analysis needs the effective application of various computational tools. Here we attempted to unravel the biological processes and cellular pathways in response to ionizing radiation using a systems biology approach.
Materials and MethodsAnalysis of gene ontology shows that 80, 42, 25, and 35 genes have roles in the biological process, molecular function, the cellular process, and immune system pathways, respectively. Therefore, our study emphasizes gene/protein network analysis on various differentially expressed genes (DEGs) to reveal the interactions between those proteins and their functional contribution upon radiation exposure.
ResultsA gene/protein interaction network was constructed, which comprises 79 interactors with 718 interactions and TP53, MAPK8, MAPK1, CASP3, MAPK14, ATM, NOTCH1, VEGFA, SIRT1, and PRKDC are the top 10 proteins in the network with high betweenness centrality values. Further, molecular complex detection was used to cluster these associated partners in the network, which produced three effective clusters based on the Molecular Complex Detection (MCODE) score. Interestingly, we found a high functional similarity from the associated genes/proteins in the network with known radiation response genes.
IntroductionIonizing radiation is harmful to human beings when it interacts with biomolecules and produces reversible and irreversible damages in the cell. The exposed individual’s changes or effects mainly depend on high and low linear energy transfer (LET). The high-LET radiations are mostly particle-based such as, alpha, beta and proton, which have more damaging effects on living cells [1]. Simultaneously, the low-LET radiation (X and γ-rays) are frequently used terminologies in the radiation biology area because many researches have been carried out to study the biological effects [2,3]. Ionizing radiation-induced cellular response mainly depends on physical factors (dose rate and dose) and biological factors (type of cell and genotype) [4]. Radiation is a two-edged sword: it could reduce tumors and induce tumors and skin irritation. Despite its possible hazards, the abundant use of radiation in medicine, especially in diagnosis and treatment, has inspired decades of studies intended to understand the mechanisms of response. The use of radiation in medical diagnostics is now drastically increased for diagnosis and screening, which also causes adverse effects on a human being [5].
Upon cellular exposure to ionizing radiation exposure involves registering daily counts of different cell types circulating in the peripheral blood, the extent and duration of the decline and subsequent recovery have been shown to correlate well with dose [6]. Moreover, there are other indicators like chromosomes [7], changes in enzyme, gene expression [8], proteins [9], and metabolic intermediates [10] are developed to date. Out of which cytogenetic indicators are widely used for estimating the dose in accidental and suspected overexposures individuals. There are several methods as cytogenetic indicators to assess the absorbed dose like dicentric [7], micronucleus assay [11], γ-H2AX [12], premature chromosome condensation [13].
Nowadays, investigations aim to interpret the molecular events that underlie the initiation and development of the damages that are primarily directed towards the profiling of biomolecules that contribute to changes in cellular function and ultimately lead to irreversible damages. In the last decade, a swift extension of omics studies related to genomics [14], transcriptomics [15], proteomics [16], and metabolomics [17] in radiation research. In DNA damage induced by ionizing radiation and ultraviolet (UV) radiation, the involvement of around 10,000 genes response is reported [18]. Rieger et al., [19] reported radiation responses by transcriptional analysis in radiotherapy associated toxicity and established 20 ionizing radiation and 4 UV radiation-responsive genes. Systems biology modeling has been used to better understand radiosensitivity by identifying novel radiation-specific biomarkers [20]. A gene regulatory network provides simplified illustrations and an easy understanding of biological processes in an organism under given circumstances [21]. For interpretation of gene regulatory network, many numbers of approaches have been proposed. However, it remains a major challenging problem in systems biology [22].
In recent years, the interest in identifying radio-responsive genes across the whole genome is of great importance. There are minimal studies on the pathway and functional enrichment analysis on radio-responsive genes. Screening of the interacting proteins which dynamically contribute to radio-responsive gene pathways with similar or identical functions would be more significant. The approach of network-based analysis is a proper method in demonstrating complex biological systems [23]. Here, we employed computational techniques to model gene/protein interaction in human lymphocytes induced upon radiation exposure. The protein-protein interactions (PPIs) are the key factors that demonstrate complex interplay crucial for the cell to survive even after the external stress and hence considered one of the essential strategies for drug target identification. In the present work, we utilized a systems biology approach to identify the essential protein involved in regulating major biological pathways, which are upregulated when the cell is exposed to radiation.
Materials and Methods1. Identification of differentially expressed genes (DEGs) radio-responsive genes from humanThe radio-responsive genes across the Homo sapiens were collected from the NCBI database (https://www.ncbi.nlm.nih.gov/). The keywords used for the search are “Differentially expressed genes” AND “Ionizing radiation-induced cell damage” AND “Homo sapiens” AND “Lymphocytes.” The entire set of data consisting of 83 genes was retrieved for further analysis (Supplementary Table S1).
2. Construction of PPI networkThe PPI network consisting of all the proteins/genes and all the neighbor interactions between them was generated for a given set of gene/proteins using STRING database (http://string-db.org/) [24]. First, based on the seed proteins interaction network was constructed associated with human proteins. These interactions were derived based on sources: text mining, experiments, databases, co-expression, neighborhood, gene fusion and co-occurrence with a high confidence level of 0.7. Later, the number of interactions was increased by customizing the maximum number of interactions to 200. Cystoscope 3.3.0 [25] was used to visualize the network to calculate the properties of the nodes and perform measurements under default parameters.
3. Topological analysis of PPI networkSeveral topological measures like degree (k), betweenness centrality (BC), eccentricity, closeness centrality (CC), eigenvector centrality (EC), and clustering coefficient were adopted to evaluate nodes of the PPI network [23,26]. From the extensive network, the hub or bottleneck protein was deducted by measuring the degree (k) and betweenness centrality (BC), where “degree” defines the number of edges linked to the node. The hub protein in a network is the node with maximum neighbors and is determined with a high degree. The BC of the node is defined as the proportion of the number of shortest paths passing through the node to the number of all the shortest paths. A node with high BC has a significant influence on the network’s influx and has more control over the network. It can represent the bottleneck in the network. The node’s score in question is contributed by the maximum connections it has, and this concept is used in scoring the EC of all the nodes in the network [27].
The connections to high-scoring nodes contribute more to the node’s score in question than parallel connections to low-scoring nodes, and the EC score was assigned to all nodes in the network based on the above concept. The distribution of edges to all possible edges with neighbors defines the clustering coefficient, which quantifies the closeness among its neighbors. The centrality of the network is measured on the parameters, like eccentricity and CC, that define the maximum distance of a node to all other nodes. A node with lower eccentricity or higher CC is closer to the other nodes and more central. Each node in the network represents a protein and the edge denotes the dynamic interaction between the nodes (proteins). This molecular organization of all the differentially connected nodes is visualized as a network. The input and output values of the node are received as mathematical functions [28].
4. Creation of the backbone network of the PPIThe proteins with high BC values are usually thought to be the bottleneck and considered to control the information flow in the transportation network. The critical node in the network with a high BC value is set at 15% of the total nodes [29,30]. This parameter of BC value and links between the proteins was used to create a backbone network.
5. Identification of densely connected regions (clusters) in the PPI networkThe biological network comprising a diverse variety of biological processes is contributed by several subnetworks or functional modules (cluster of proteins). These modules will influence on specific functionality of participating nodes, even which have no impact on the core network [31]. The global network was subjected to cluster analysis to identify densely connected regions in the network using the Molecular Complex Detection (MCODE) 4.1, a plug-in for Cytoscape. This approach detects dense and connected regions by weighting nodes based on their local neighborhood density [32]. This method weights a vector by local neighborhood density, chooses a few seeds with high weights and isolates the dense regions according to given parameters. All the parameters such as degree threshold, node score threshold, k-core threshold, and max depth of network were kept regular at 2, 0.2, 4, and 100, respectively. To ensure that MCODE is not unduly affected by the expected high false-positive rate in large-scale interaction data set of whole networks. The k-core is a subgraph in which each vertex has a degree of at least k. The highest k-core of a graph is the most densely connected subgraph.
6. Functional enrichment analysisA comprehensive analysis and visualization of a functionally enriched set of genes were performed using ClueGO [33], a Cytoscape plug-in that enormously improves the biological interpretation of large lists of genes. A functionally organized GO/pathway term network was created by integrating gene ontology (GO) terms and KEGG (Kyoto Encyclopedia of Genes and Genome)/BioCarta pathways. We considered the first neighbors of the hub protein S-glycoprotein for the functional enrichment analysis. A total of 76 neighbors were found to interact with the S-glycoprotein. Parameters specified for protein/gene list enrichment analysis, with statistical test-enrichment/depletion (two-side hypergeometric test), correlation test-Bonferroni step down, Min GO level-3, Max GO level-8, Kappa score threshold-0.4, GO fusion-false, GO group-true, and p ≤ 0.05.
7. Pathway enrichment analysisShinyGO [34] is an intuitive, graphical tool for enrichment analysis for investigators to understand the biological meaning behind a large list of genes, and the KEGG database [35] was used in this study. Parameters specified for protein/gene list enrichment analysis such as KEGG analysis; reference set, Homo sapiens genome; the minimum number of genes was set to “30”; and significance level (p = 0.05).
ResultsWe constructed a gene network on 83 DEGs and evaluated the functional enrichment of functional partners using ClueGO and ShinyGO with the p-value of <0.05 of ionizing radiation-induced cell damages in humans.
1. PPI network of DEGsThe PPI was depicted by assembling the ionizing radiation-induced damage associated with a human using the STRING database, which returned interactions for 79 DEGs out of 83 unique genes (Fig. 1). The number of edges connected to a designated node is high degree, implying the protein’s significance in the biological interactions. The PPI network’s classical character is that it is characterized by a small number of highly connected nodes and the other nodes with only a few connections.
2. Network topology analysisNetwork Analyzer v.3.3.1 was employed to evaluate the confidence of the core interactome, using Power law fit of the form y=axb. Power law uses the least square method to some topological parameters and considers points with positive coordinate values for the fit. The BC, CC, and topology correlation coefficient scores 0.823, 0.200, and 0.25, respectively, were considered as network topology parameters. Additionally, the neighborhood connectivity (=0.546) and shortest path length distribution were also considered for analysis. These various topological parameters considered for the network generation by using the above cut-off values were graphically plotted (Supplementary Fig. S1). The extended global network topological measures of two PPI networks, i.e., giant or core network and backbone or subnetwork, were represented in Table 1. Therefore, the biological process is essentially regulated by the bottleneck node in the interactome.
The subnetwork was constructed from 78 nodes with high BC values, the size of which corresponds to their BC value and 710 links between them (Fig. 2). The TP53 was identified as the hub protein having the highest BC value of 0.0756 with the most significant degree of 13 in the subnetwork. This hub protein has nine other neighbors sharing a little less with BC, degree, and CC (Table 2). Out of 79 nodes of the network, the top 10 nodes with high BC values are projected as crucial nodes, such as TP53, MAPK8, MAPK1, CASP3, MAPK14, ATM, NOTCH1, VEGFA, SIRT1, and PRKDC. To distinguish these nodes in the network and their roles, they were highlighted with different colors (Fig. 2).
3. Key nodes in the PPI networkTo predict and study the key nodes or hub proteins of the giant network, topological parameters have been calculated with Network Analyzer v3.3.1. Three topological properties are essential to find out the key nodes of any network. Therefore, after getting the giant network, according to each distinct attribute, each node’s BC value has to be measured and a comparison can be made to find out the ascending order of the BC values. The nodes with a large degree or high BC are considered as the key nodes in the network. These key nodes are based on the critical point of large degree and high BC, which is set as 15% of the network’s total nodes set. The nodes with large BC (Table 3) and large degree (Table 4) are crucial in the backbone network.
After calculation, eleven proteins have been selected by their large BC value for a backbone network. The total number of nodes in the giant network is 79 (fusion); among them, 11 proteins with high BC value have been chosen, which are TP53, AKT1, MAPK8, MAPK1, VEGFA, ATM, IL6, MAPK3, STAT3, CASP3, and PTEN to form backbone network (Fig. 3).
4. Crosstalk between the high BC nodes in the network and signaling pathway derived from the backbone networkThe backbone network consists of 11 high BC nodes, which corresponds to their BC value and the 55 links between them (Fig. 3). Without calculating BC and CC values, we can find out that TP53 is located at the center of the backbone network with the highest BC value and the largest degree. TP53 has 10 first neighbors: AKT1, MAPK8, MAPK1, VEGFA, ATM, IL6, MAPK3, STAT3, CASP3, and PTEN. These proteins are also critically involved in important biological processes like histone deacetylation regulation, regulation of cytochrome C release from mitochondria, and regulation of telomere capping and telomere activity. Further, these proteins participate in the p53 signaling pathway, FoxO signaling pathway, toxoplasmosis, prolactin signaling pathway.
5. Clustering analysisMCODE was used for clustering the genes based on the connectivity scores and identified the three clusters (C1–C3) from the entire network based on the interactions between the genes. To ensure the efficiency of functional DEGs partners, we adopted the default MCODE parameters for clustering analysis. We found a total of 55 functional partners among all the clusters. The first cluster possessed 19 nodes with a score of 11.882, while the second cluster contained 14 nodes with a score of 5.714 and the third cluster contained 22 nodes with a score of 5.524 (Fig. 4, Table 5).
6. Functional enrichment analysisThe functional enrichment analysis of all the DEGs was performed using the ClueGO tool, which resulted from the enriched GO terms such as cellular process, molecular function, and biological process. Thus, the significant GO terms were selected based on the p-value (p = 0.05). There are 718 functional interactions from where the corresponding GO terms were extracted. It was found that 79 genes are found to have a role in biological processes, 42 genes in molecular function, 25 genes for cellular process and 35 genes in immune system pathways from the ClueGO (Fig. 5). Subsequently, we analyzed the functional enrichment in ShinyGO to ensure the significance of functions. Although these results coincided with the ShinyGO, we found differences in p-value. From the annotation analysis, the GO terms (DEGs data) of the functional partners from ClueGO and ShinyGO were compared with the p-value, which is depicted in Supplementary Table S2 to summarize the essential KEGG pathways.
Further, the functional enrichment analysis was carried out for the three clusters obtained from the giant network. The functional enrichment analysis of 19 interacting genes in the C1 cluster (Fig. 6) with a clustering coefficient of 0.383. The pathway enrichment analysis for the C1 cluster genes was found majorly in the p53 pathway that proves the hypothesis availed from the earlier biological studies (Fig. 7). The cluster C2 comprises 14 interactors with a clustering coefficient value of 0.309 (Fig. 8). Similarly, Fig. 9 represents the GO/pathway terms specific for cluster 3 (C3) genes in response to radiation response upon human lymphocytes: the biological process, cellular component, molecular function, and pathway analysis (KEGG, 22 nodes).
Discussion and ConclusionIn our study, the genes/proteins that have been differentially expressed during radiation exposure were considered for network construction. The information of these DEG's biological and molecular complexes and signaling pathways responsible for the cellular damage upon radiation exposure is of immense importance to developing potent radioprotective therapeutics. This computational approach of network construction, clustering and topological analysis, and functional enrichment of the participating genes and their functional partners is essential to unravel the complex biological mechanisms initiated upon radiation induction upon the cells. The shortest path length and high CC genes are considered the controlling point of molecular communication in the network.
DNA damages are complex due to multiple transcription factors involved, resulting from cellular stresses caused by the radiation. In this respect, all the interactor’s functional enrichment analysis was carried out using the ClueGO tool. We found that genes in the network play a significant role in biological processes related to the regulation of DNA recombination (GO:0000018), cell-cycle checkpoint (GO:0000075), DNA damage checkpoint (GO: 0000077), response to reactive oxygen species (GO:0000302), telomere maintenance (GO:0000723), double-strand break repair via homologous recombination (GO:0000724), DNA synthesis involved in DNA repair (GO:0000731), regulation of cell growth (GO:0001558), B-cell homeostasis (GO:0001782), telomere capping (GO:0016233), response to ionizing radiation (GO:0010212), cell-cycle arrest (GO:0007050), response to oxidative stress (GO:0006979), DNA damage response, signal transduction by p53 class mediator resulting in transcription of p21 class mediator (GO:0006978). Molecular functions such as signal transducer, downstream of the receptor with serine/threonine kinase activity (GO:0004702), cyclic-dependent protein serine/threonine kinase regulator activity (GO:00165380), phosphatase binding (GO:0019902), protein phosphatase binding (GO:0019903). The cellular components include cyclin-dependent protein kinase holoenzyme complex (GO:0000307), chromosome and telomeric region (GO:000078) and nuclear chromosome/telomeric region (GO:0000784). Additionally, the immune system process in which these genes are differentially expressed is also identified, such as lymphocyte activation involved in immune response (GO:0002285), lymphocyte proliferation (GO:0046651), and regulation of lymphocyte proliferation (GO:0050670). Further, the enriched KEGG pathways include homologous recombination (KEGG:03440), cell cycle (KEGG:04110), p53 signaling pathway (GO:04115), apoptosis (KEGG:04210), Wnt signaling pathway (KEGG:04810), T-cell receptor signaling pathway (KEGG:04660), B-cell receptor signaling pathway (KEGG:04662), and glioma (KEGG:05214). These enriched GO terms provide information of the genes responsible for cell cycle checkpoint, DNA damage checkpoint, telomere maintenance and DNA damage response, signal transduction of p53 class mediator resulting in transcription of p21 class mediator (Supplementary Table S2).
The clustering analysis between 79 interactors with 718 unique functional interactions using MCODE has given the dense local graph of the gene complexes. Based on the connectivity score obtained from MCODE, three clusters (C1–C3) were obtained. Each cluster was further enriched with GO terms related to the ionizing radiation response in cells. The functional enrichment analysis of 19 interacting genes in the C1 cluster (BCL2, BCL2L1, ERBB2, IGF1, IL6, KRAS, MAPK14, MTOR, PTGS2, RELA, STAT3, TLR2, TP53, and VEGFA) are responsible for cell aging, which is one of the radiation-induced effects. A report reveals that p53 can initiate different cellular effector processes, like cell cycle arrest, cellular senescence, coordinating with numerous DNA damage repair pathways, metabolic adaptation and apoptotic cell death [36]. It is observed that the response depends on cell types to the activation of p53 by DNA damage. The T-lymphocytes frequently suffer extensive apoptosis, whereas fibroblasts undergo growth arrest. It reflects in differential induction of relevant target genes. Ionizing radiation induces Bax and rapid apoptosis in lymphoid and myeloid cells. Triggered p53 stimulates cellular responses that eventually lead to growth arrest and apoptosis (programmed cell death) [37]. It has been demonstrated that the role of p53 was important for radiation-induced death in thymocytes and chemotherapy-induced apoptosis in fibroblasts expressing deregulated oncogenes in p53 knockout mice [38,39]. It is also evident that pathways with p53–Bcl-2 signaling promote cell death [40]—the p53 acts as a molecular target for insulin-like growth factor 1 receptor (IGF-1R). Though IGF-1R has a role in controlling cell proliferation, differentiation and apoptosis, IGF-1R overexpression was found to enhance invasion, malignant cell proliferation, survival, and metastasis [41].
The enriched molecular functions like phosphatidylinositol-4,6-bisphosphate 3-kinase activity (ERBB1, IL6, PIK3CA) and BH3 domain binding (BCL2, BCL2L1, MCL1) are induced after exposure to ionizing radiation that leads to the triggering of adaptive cellular responses [42]. The genes from cluster C2 like AKT1, HSP90AA1, ICAM1, and TGFB1, are involved in the biological process like positive regulation of reactive oxygen species metabolic process. Manning and Toker [43] reported that AKT1 influences numerous cellular processes, e.g., protein synthesis, cell metabolism, cell proliferation, apoptosis, and cell survival. The KEGG pathways like the p13k-Akt signaling pathway (CDK2, AKT1, HSP30AA1, IGF1R, NFKB1, and MAPK3) and glioma (CDKN2A, AKT1, IGF1R, and MAPK3). It was reported that Cdk/cyclin complexes have a major role in the regulation of the cell cycle and are thus found to be prime targets of inhibition during cellular stress, DNA damage, and telomere dysfunction [44]. In comparison with the other two clusters, the C3 cluster (clustering coefficient = 0.330) claimed to be very important since many of the genes here are enriched after the radiation exposure, like telomere maintenance via recombination (BRCA2, ERCC1, RAD51), double-stranded break repair via non-homologous end-joining (ATM, CD40, ERCC1, PEKDC), response to ionizing radiation (ATM, BRCA1, BRCA2, ERCC1, PRKDC, RADS1, SIRT1, and SOD2), telomere capping (ATM, ERCC1, MAPK1, PRKDC). We also found that the enriched pathways in the C3 cluster like homologous recombination (KEGG: 03440). ATM regulates the cellular response to radiation-induced DNA damage and it is a key determinant of radiosensitivity. The ATM-p53 pathway mediates radiation-induced DNA repair and, thus, ATM inhibitors' clinical use as radiosensitizers in cancer therapy [45]. We established that the integrated network biology approach facilitated pathway analysis, hypothesis generation and identification of the critical genes (hub) involved in response towards ionizing radiation.
In conclusion, we have demonstrated an integrated bioinformatics approach that includes an expert-guided examination of data to define a radiation-induced cellular response. In this approach, the network was constructed and analyzed using DEGs and identified the top 10 genes/proteins that participate in cellular mechanisms crucial during cellular stress. The TP53 is the hub protein in the entire network with a high degree and BC score. The functional enrichment analysis and pathway analysis have revealed that TP53, CDK2, BCL, ATM, and AKT are also vital proteins that are upregulated in almost all the molecular processes during radiation-induced damages. Further, substantial research is required to define the molecules and processes mediating radiation-induced translational control. However, understanding the impact of DEGs upon radiation would provide innovative vision into the cellular radioresponse, ensuring an opportunity to improve therapeutic efficacy.
Supplementary MaterialsSupplementary materials can be found via https://doi.org/10.3857/roj.2021.00045.
Fig. S1.Graphical representation of topological parameters: (A) betweenness centrality, (B) closeness centrality, (C) neighbourhood connectivity, and (D) shortest path length distribution. Table S1.List of DEGs retrieved from NCBI public database, considered for PPI network construction and analysis Table S2.Gene Ontology (GO) studies of biological process, molecular function, cellular component, and protein class through functional enrichment analysis of the densely connected regions like cluster 1 with a threshold of p < 0.05 Fig. 1.Extended interactome construction of radiation induced differentially expressed genes network from human lymphocytes showing 83 nodes and 718 edges. 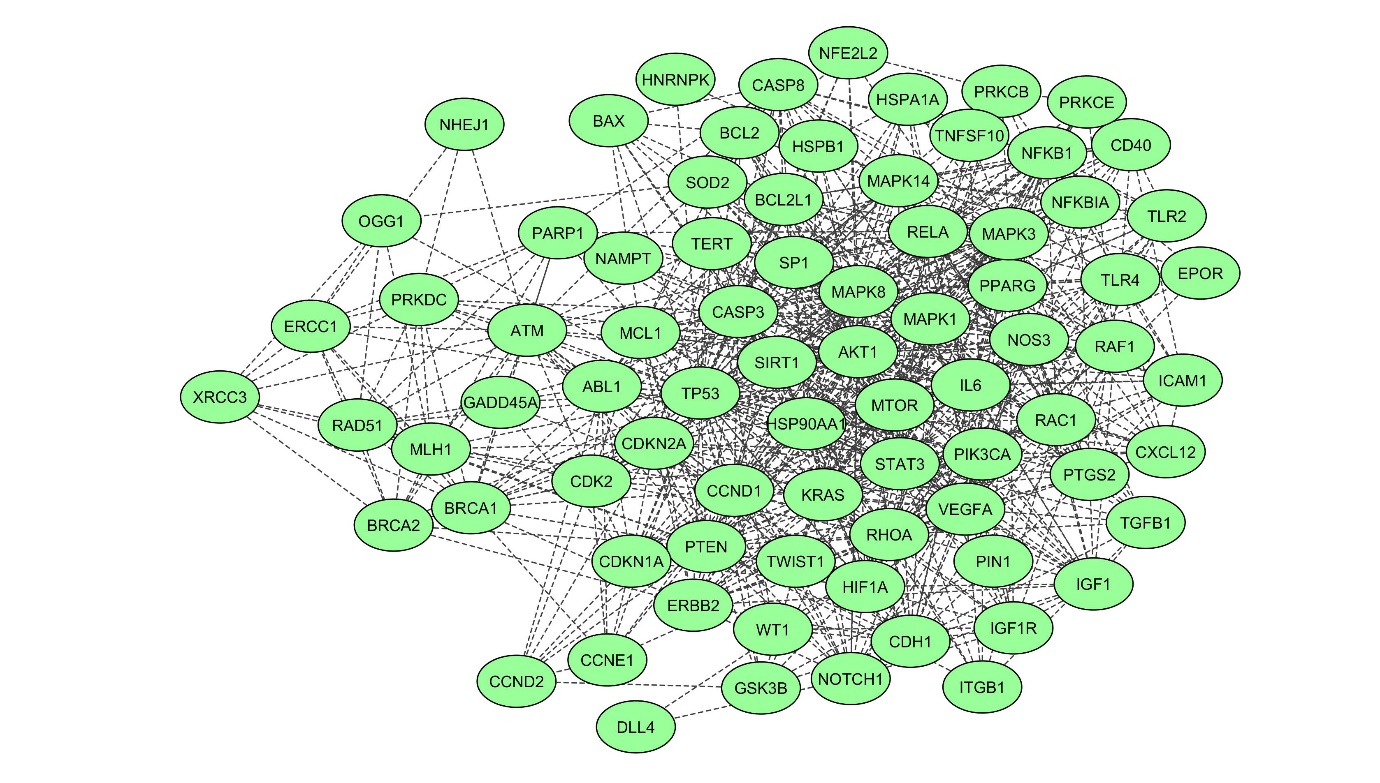
Fig. 2.Subnetwork showing top 10 proteins. The subnetwork consisted of 302 nodes and 5,025 edges. Key nodes in the network are highlighted in different colours. The color of the nodes corresponds to their betweenness centrality (BC) and degree (D): red denotes node as hub or node with high BC and D; orange showing second rank hub node; and yellow showing node with low BC and D. 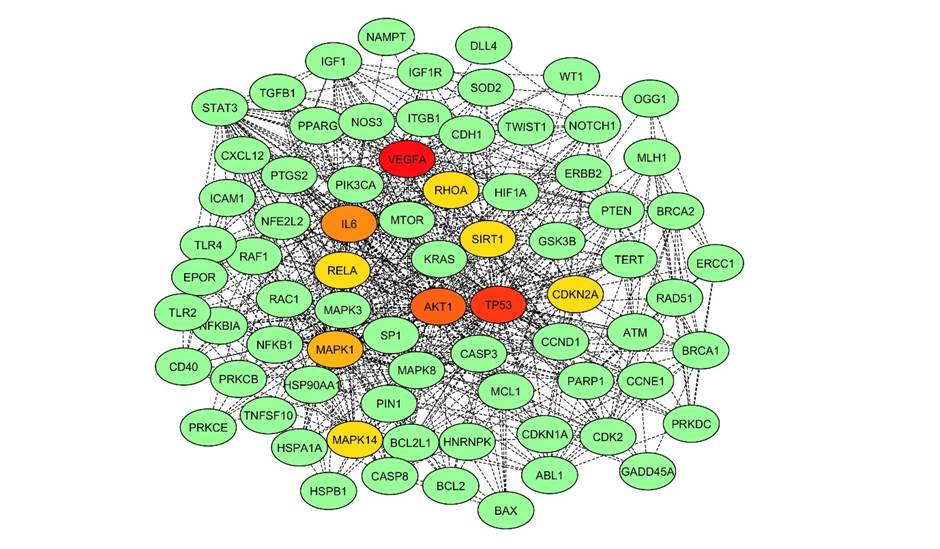
Fig. 3.The topology of the backbone network. The backbone network consists from 11 nodes with high betweenness centrality (BC) value. The size of nodes corresponds to their BC values. 
Fig. 4.Clustering analysis of radio-responsive genes. Gene clusters as viewed in Cytoscape are shown along with the unclustered genes. The clusters are ranked from cluster C1 to C3 according to the Molecular Complex Detection (MCODE) score. For easy distinction, genes belonging to cluster C1 are highlighted with blue, cluster C2 genes are highlighted with purple, and C3 cluster genes are highlighted with deep yellow. The clustered and unclustered genes are represented by circles and seed genes of each cluster are highlighted with brick red. 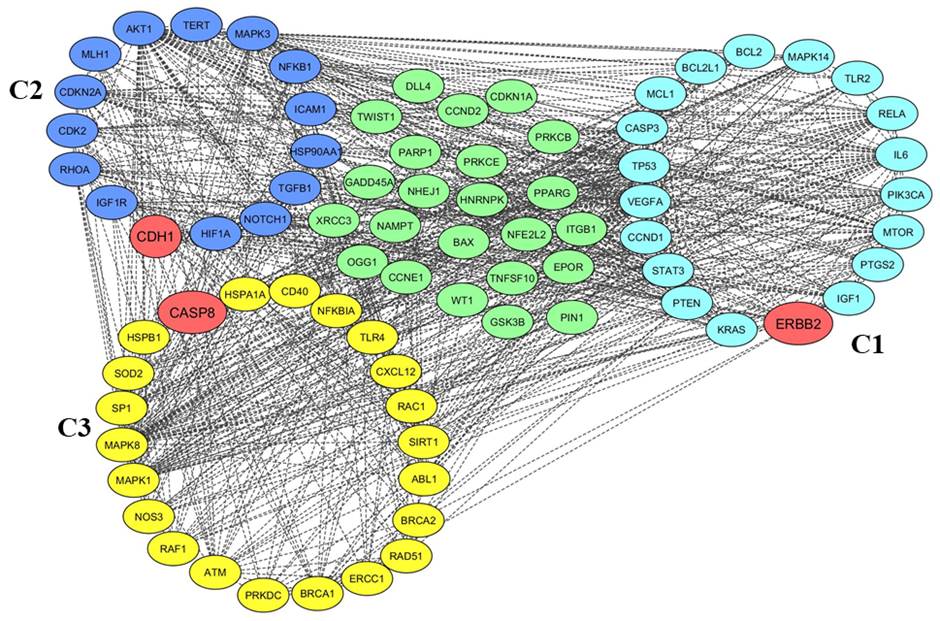
Fig. 5.The pie chart from ClueGO analysis indicates overview specific cluster of differentially expressed genes of Gene Ontology (GO)/pathway terms specific for response to radiation upon human lymphocytes: (A) the biological process, (B) cellular function, (C) molecular function, and (D) pathway analysis (Kyoto Encyclopedia of Genes and Genome [KEGG], 79 nodes). *p < 0.05, **p < 0.01, statistical significance for enriched GO terms. 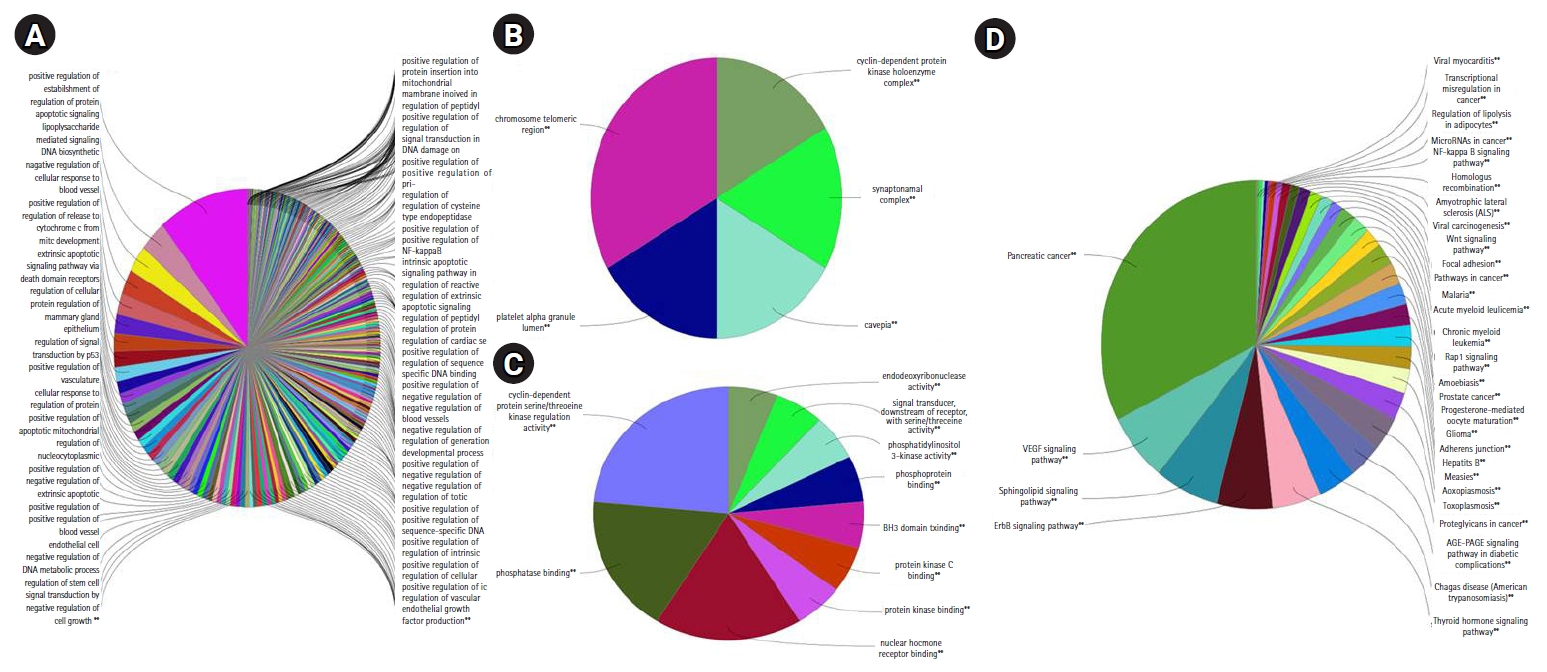
Fig. 6.Gene Ontology/pathway terms specific for cluster 1 (C1) genes in response to radiation response upon human lymphocytes: (A) the biological process, (B) molecular function, and (C) pathway analysis (Kyoto Encyclopedia of Genes and Genome [KEGG], 19 nodes). **p < 0.01, statistical significance for enriched GO terms. 
Fig. 7.Schematic illustration of the differentially expressed genes mapped in p53 signalling pathway, which are upregulated after radiation exposure (highlighted in red). 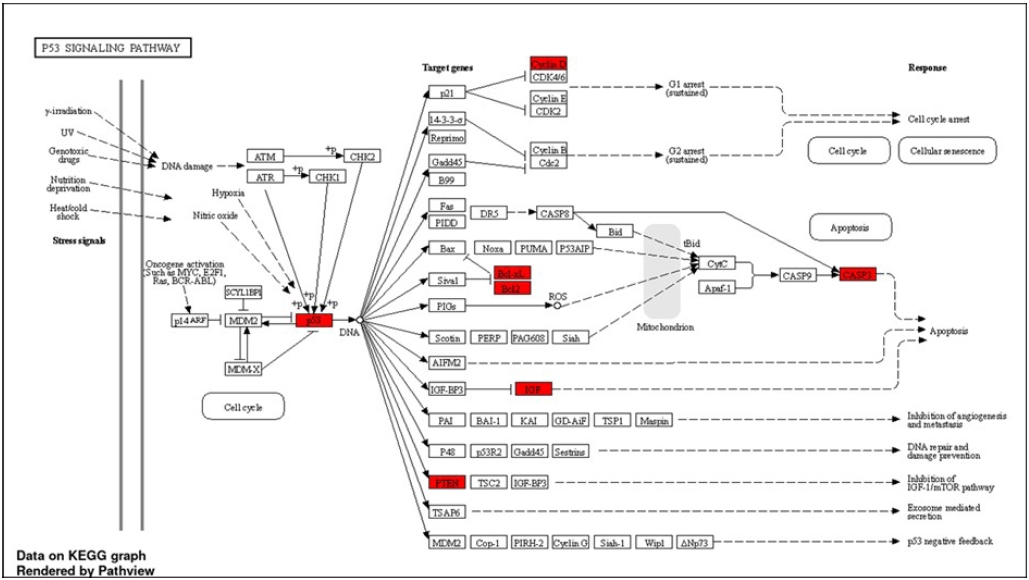
Fig. 8.Gene Ontology/pathway terms specific for cluster 2 (C2) genes in response to radiation response upon human lymphocytes: (A) the biological process and (B) pathway analysis (Kyoto Encyclopedia of Genes and Genome [KEGG], 15 nodes). The bars represent the number of genes associated with the terms. The percentage of genes per term is shown as a bar label. Terms with up- and down-regulated genes are shown in red and green, respectively. The colour gradient shows the gene proportion of each cluster associated with the term. Equal proportions of the two clusters are represented in white. 
Fig. 9.GO/pathway terms specific for cluster 3 (C3) genes in response to radiation response upon human lymphocytes: (A) the biological process, (B) cellular component, (C) molecular function, and (D) pathway analysis (Kyoto Encyclopedia of Genes and Genome [KEGG], 22 nodes). The bars represent the number of genes associated with the terms. The percentage of genes per term is shown as a bar label. Terms with up- and down-regulated genes are shown in red and green, respectively. The color gradient shows the gene proportion of each cluster associated with the term. Equal proportions of the two clusters are represented in white. 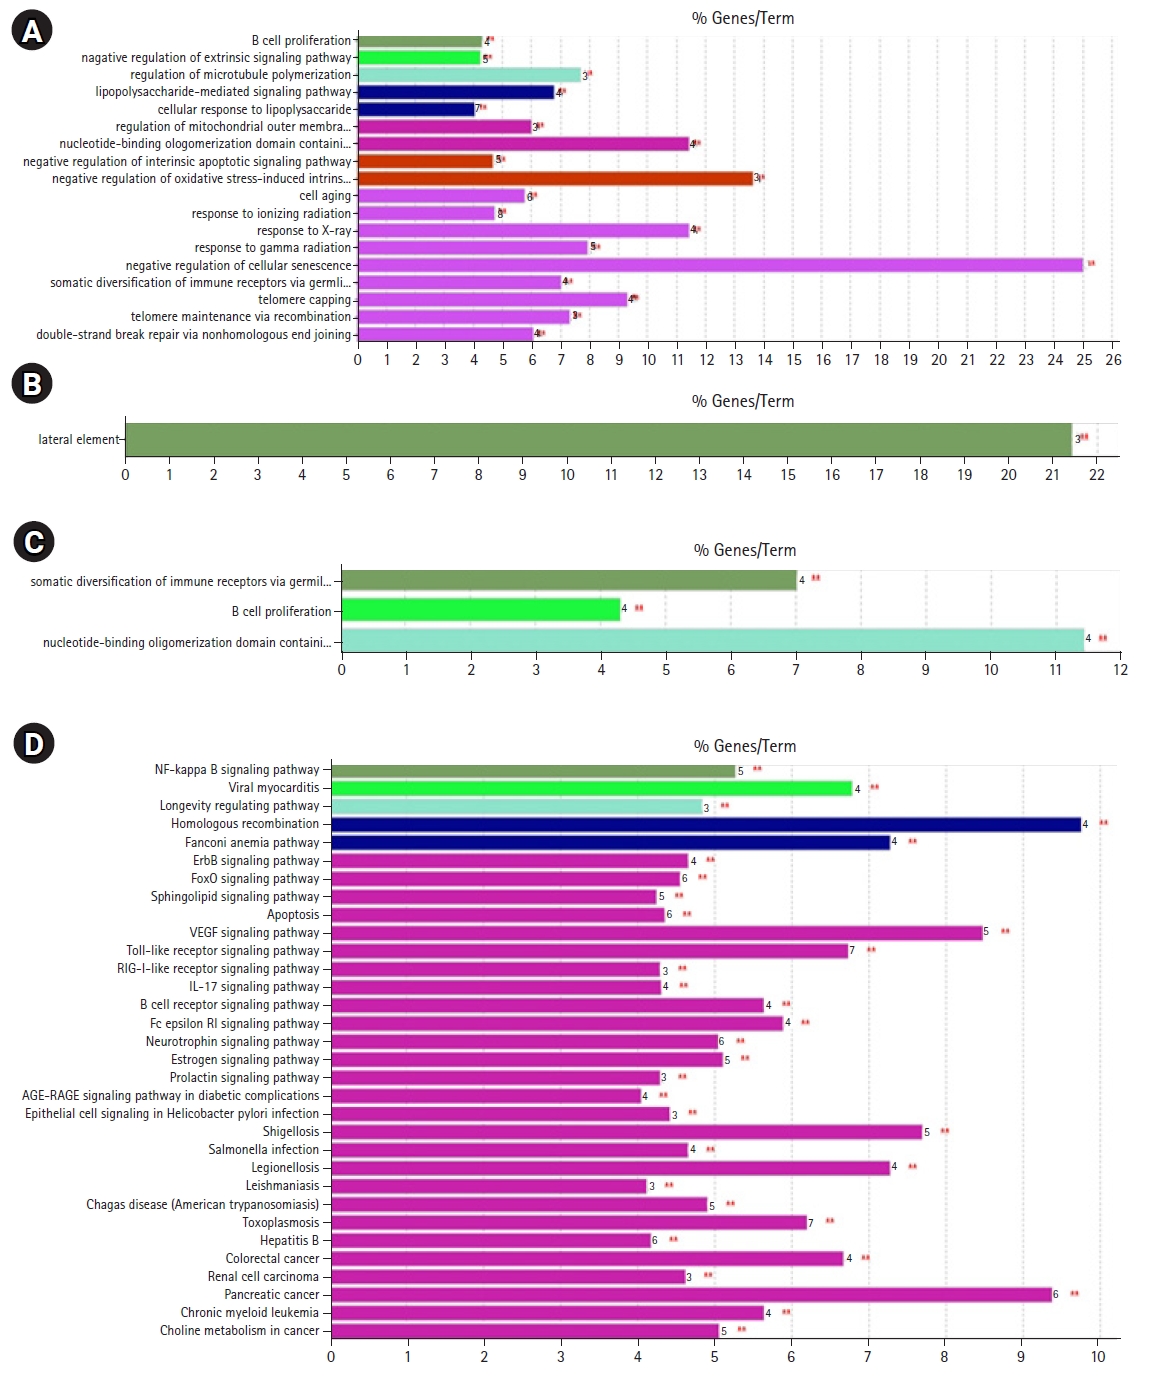
Table 1.Extended network topological measures of two protein-protein interaction networks Table 2.Proteins in the subnetwork showing the hub protein based on the degree and BC Table 3.The list of high BC nodes and their CC values Table 4.The list of large degree nodes and their CC values Table 5.Genes belonging to each cluster with respective MCODE scores and clustering coefficients References1. Miszczyk J, Rawojc K, Panek A, Swakon J, Prasanna PG, Rydygier M. Response of human lymphocytes to proton radiation of 60 MeV compared to 250 kV X-rays by the cytokinesis-block micronucleus assay. Radiother Oncol 2015;115:128–34.
2. Konopacka M, Rogolinski J. Thiamine prevents X-ray induction of genetic changes in human lymphocytes in vitro. Acta Biochim Pol 2004;51:839–43.
3. Antoccia A, Sgura A, Berardinelli F, et al. Cell cycle perturbations and genotoxic effects in human primary fibroblasts induced by low-energy protons and X/gamma-rays. J Radiat Res 2009;50:457–68.
4. Brooks AL, Hoel DG, Preston RJ. The role of dose rate in radiation cancer risk: evaluating the effect of dose rate at the molecular, cellular and tissue levels using key events in critical pathways following exposure to low LET radiation. Int J Radiat Biol 2016;92:405–26.
5. Pearce MS, Salotti JA, Little MP, et al. Radiation exposure from CT scans in childhood and subsequent risk of leukaemia and brain tumours: a retrospective cohort study. Lancet 2012;380:499–505.
6. Vorobiev AI. Acute radiation disease and biological dosimetry in 1993. Stem Cells 1997;15 Suppl 2:269–74.
7. Bhavani M, Tamizh Selvan G, Kaur H, et al. Dicentric chromosome aberration analysis using giemsa and centromere specific fluorescence in-situ hybridization for biological dosimetry: an inter- and intra-laboratory comparison in Indian laboratories. Appl Radiat Isot 2014;92:85–90.
8. Lacombe J, Sima C, Amundson SA, Zenhausern F. Candidate gene biodosimetry markers of exposure to external ionizing radiation in human blood: a systematic review. PLoS One 2018;13:e0198851.
9. Lee Y, Pujol Canadell M, Shuryak I, et al. Candidate protein markers for radiation biodosimetry in the hematopoietically humanized mouse model. Sci Rep 2018;8:13557.
10. Pannkuk EL, Fornace AJ Jr, Laiakis EC. Metabolomic applications in radiation biodosimetry: exploring radiation effects through small molecules. Int J Radiat Biol 2017;93:1151–76.
11. Selvan GT, Bhavani M, Vijayalakshmi J, Paul Solomon FD, Chaudhury NK, Venkatachalam P. Delayed mitogenic stimulation decreases DNA damage assessed by micronucleus assay in human peripheral blood lymphocytes after (60)co irradiation. Dose Response 2014;12:498–508.
12. Venkateswarlu R, Tamizh SG, Bhavani M, et al. Mean frequency and relative fluorescence intensity measurement of γ-H2AX foci dose response in PBL exposed to γ-irradiation: an inter- and intra-laboratory comparison and its relevance for radiation triage. Cytometry A 2015;87:1138–46.
13. Balakrishnan S, Shirsath K, Bhat N, Anjaria K. Biodosimetry for high dose accidental exposures by drug induced premature chromosome condensation (PCC) assay. Mutat Res 2010;699:11–6.
14. Robson T, West C. Radiation and the genome: from risks to opportunities for therapeutic exploitation. Br J Radiol 2010;83:635–7.
15. Michna A, Schotz U, Selmansberger M, et al. Transcriptomic analyses of the radiation response in head and neck squamous cell carcinoma subclones with different radiation sensitivity: time-course gene expression profiles and gene association networks. Radiat Oncol 2016;11:94.
16. Chevalier F, Hamdi DH, Saintigny Y, Lefaix JL. Proteomic overview and perspectives of the radiation-induced bystander effects. Mutat Res Rev Mutat Res 2015;763:280–93.
17. Johnson CH, Patterson AD, Krausz KW, et al. Radiation metabolomics. 5. Identification of urinary biomarkers of ionizing radiation exposure in nonhuman primates by mass spectrometry-based metabolomics. Radiat Res 2012;178:328–40.
18. Rieger KE, Chu G. Portrait of transcriptional responses to ultraviolet and ionizing radiation in human cells. Nucleic Acids Res 2004;32:4786–803.
19. Rieger KE, Hong WJ, Tusher VG, Tang J, Tibshirani R, Chu G. Toxicity from radiation therapy associated with abnormal transcriptional responses to DNA damage. Proc Natl Acad Sci U S A 2004;101:6635–40.
20. Eschrich S, Zhang H, Zhao H, et al. Systems biology modeling of the radiation sensitivity network: a biomarker discovery platform. Int J Radiat Oncol Biol Phys 2009;75:497–505.
21. Vignes M, Vandel J, Allouche D, et al. Gene regulatory network reconstruction using Bayesian networks, the Dantzig Selector, the Lasso and their meta-analysis. PLoS One 2011;6:e29165.
22. Brouard C, Vrain C, Dubois J, Castel D, Debily MA, d'Alche-Buc F. Learning a Markov Logic network for supervised gene regulatory network inference. BMC Bioinformatics 2013;14:273.
23. Barabasi AL, Oltvai ZN. Network biology: understanding the cell's functional organization. Nat Rev Genet 2004;5:101–13.
24. Szklarczyk D, Gable AL, Lyon D, et al. STRING v11: protein-protein association networks with increased coverage, supporting functional discovery in genome-wide experimental datasets. Nucleic Acids Res 2019;47:D607–13.
25. Su G, Morris JH, Demchak B, Bader GD. Biological network exploration with Cytoscape 3. Curr Protoc Bioinformatics 2014;47:8.13.1-24.
27. Assenov Y, Ramirez F, Schelhorn SE, Lengauer T, Albrecht M. Computing topological parameters of biological networks. Bioinformatics 2008;24:282–4.
28. Jeanquartier F, Jean-Quartier C, Holzinger A. Integrated web visualizations for protein-protein interaction databases. BMC Bioinformatics 2015;16:195.
29. Newman ME. A measure of betweenness centrality based on random walks [Internet]. Ithaca, NY: arXiv.org; 2003 [cited 2021 Mar 1]. Available from: https://arxiv.org/abs/cond-mat/0309045.
30. Goni J, Esteban FJ, de Mendizabal NV, et al. A computational analysis of protein-protein interaction networks in neurodegenerative diseases. BMC Syst Biol 2008;2:52.
31. Mitra K, Carvunis AR, Ramesh SK, Ideker T. Integrative approaches for finding modular structure in biological networks. Nat Rev Genet 2013;14:719–32.
32. Bader GD, Hogue CW. An automated method for finding molecular complexes in large protein interaction networks. BMC Bioinformatics 2003;4:2.
33. Bindea G, Mlecnik B, Hackl H, et al. ClueGO: a Cytoscape plug-in to decipher functionally grouped gene ontology and pathway annotation networks. Bioinformatics 2009;25:1091–3.
34. Ge SX, Jung D, Yao R. ShinyGO: a graphical gene-set enrichment tool for animals and plants. Bioinformatics 2020;36:2628–9.
35. Kanehisa M, Furumichi M, Tanabe M, Sato Y, Morishima K. KEGG: new perspectives on genomes, pathways, diseases and drugs. Nucleic Acids Res 2017;45:D353–61.
37. Sionov RV, Haupt Y. The cellular response to p53: the decision between life and death. Oncogene 1999;18:6145–57.
38. Clarke AR, Purdie CA, Harrison DJ, et al. Thymocyte apoptosis induced by p53-dependent and independent pathways. Nature 1993;362:849–52.
39. Lowe SW, Ruley HE, Jacks T, Housman DE. p53-dependent apoptosis modulates the cytotoxicity of anticancer agents. Cell 1993;74:957–67.
|
|
||||||||||||||||||||||||||||||||||||||||||||

 |
 |