Clinical utilization of radiation therapy in Korea between 2017 and 2019
Article information
Abstract
Purpose
This study aimed to evaluate the clinical infrastructure and utilization of radiotherapy (RT) services in Korea between 2017 and 2019.
Materials and Methods
We extracted the data of patients who underwent RT between 2017 and 2019 from the Health Insurance Review and Assessment Service. We further analyzed this data according to the diagnosis and treatment modalities of patients diagnosed with International Classification of Disease 10 (ICD-10) diagnostic codes C00–C97 and D00–D48. In addition, we collected statistics on RT facilities in Korea using a nationwide survey.
Results
The total number of patients who received RT in 2017, 2018, and 2019 were 77,901, 81,849, and 87,460, respectively. The number of patients diagnosed with ICD 10 C- and D-codes in 2019 was 86,339, of whom 39,467 were men and 46,872 women. The rate of utilization of RT among cancer patients was 30.4% in 2017 and 2018 and 30.9% in 2019. In 2019, the most common types of cancers treated with RT were breast, lung, prostate, colorectal, and liver cancers. Regarding the RT infrastructure in Korea, there were 95 radiation oncology centers, 237 megavoltage (MV) teletherapy units, 35 brachytherapy units, and two proton accelerators in 2019. There were 4.5 MV teletherapy machines per million.
Conclusion
The number of patients treated with RT has increased consistently from 2017 to 2019. As the number of patients with cancer increases, it is expected that the RT infrastructure will be further expanded in Korea.
Introduction
Cancer is the most common cause of death in Korea, accounting for 27.5% of all deaths [1]. According to recent research, the global burden of cancer was 19.3 million new cases, and is responsible for 10.0 million deaths in 2020 [2]. In Korea, 254,718 patients were newly diagnosed with cancer and 81,203 of these patients died of different types of cancer in 2019 [3]. Although cancer mortality rates have been decreasing over the past few decades, prevalence of cancer is still increasing. Therefore, the value and requirement of radiotherapy (RT), which is an essential part of cancer treatment, is expected to increase [4,5].
Although the data regarding RT utilization in Korea was analyzed using questionnaires from each institution until 2006, we obtained more accurate information including details on diagnosis, treatment, and demographic characteristics from the Health Insurance Review and Assessment Service (HIRA) [6-10]. This study presents the most recent statistics on the clinical utilization of radiotherapy between January 2017 and December 2019 in Korea.
Materials and Methods
This study was performed after the approval of the Institutional Review Boards (No. KIRAMS 2020-08-001). First, we obtained the claims data of patients treated with RT from HIRA between 2017 and 2019. We then analyzed patients with diagnostic codes C00−C97 and D00−D48 according to the 10th edition of the International Classification of Diseases (ICD-10) to evaluate the clinical utility of RT in cancer patients. The detailed methods are described in previous reports [8-10]. This study used HIRA research data (M20190625815) prepared by HIRA, and the views expressed are those of the authors and not necessarily those of the HIRA and the Ministry of Health and Welfare.
We assessed the number of patients who received RT according to the diagnostic codes, gender, and age group between 2017 and 2019. For convenience of reporting, we adopted and modified the cancer classification based on the GLOBOCAN Cancer Dictionary [11]. The overall utilization rate was calculated as the ratio of RT cases to the number of newly diagnosed patients during that year. Because we could count the overall patients by diagnosis from the HIRA, it includes patients who experience recurrence and are treated after the first diagnosis. Therefore, the utilization rate does not refer to the rate of radiotherapy for newly diagnosed patients. Population and cancer incidence data were obtained from the Korean Statistical Information Service and previous reports [1,3,12,13]. We analyzed the number of patients who received certain radiotherapy modalities, including brachytherapy, stereotactic radiation therapy (SRT), and proton therapy using appropriate procedure codes. Regional disparities were also investigated based on the location where patients received RT. In addition, the nationwide survey assessed RT infrastructure, including the number of RT centers and equipment between 2017 and 2019.
Results
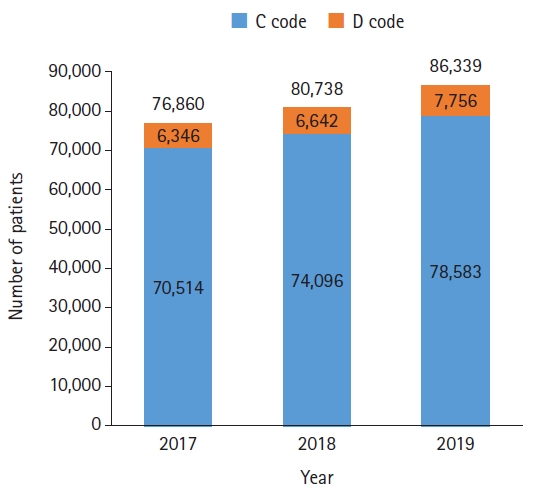
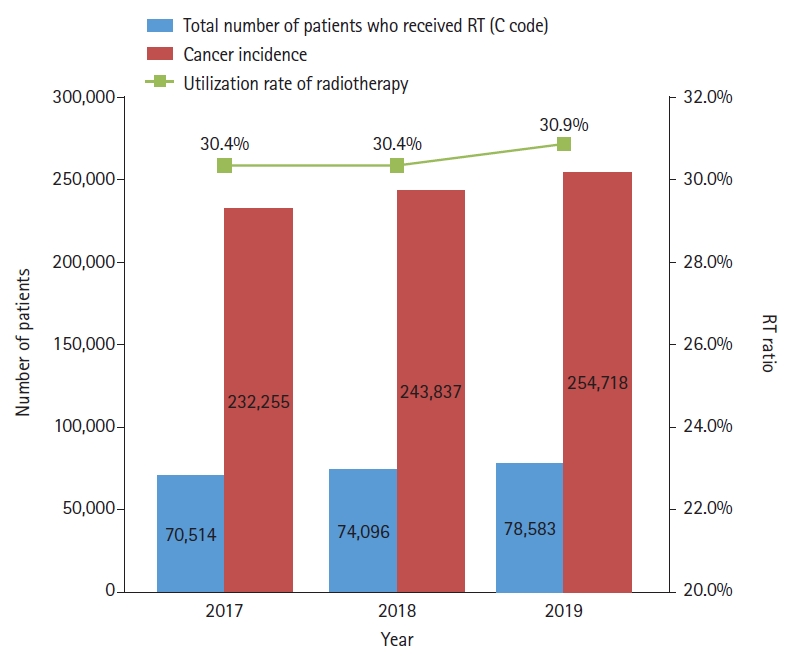
The overall numbers of patients who received RT in 2017, 2018, and 2019 were 77,901, 81,849, and 87,460, respectively. When we estimated the patients with C- and D-codes, the number of patients treated with RT in 2017, 2018, and 2019 was found to be 76,860, 80,738, and 86,339, respectively (Fig. 1). The number of patients treated with RT in 2019 increased by 6.9% compared to the number in 2018. In 2019, the total numbers of male and female patients were 39,467 and 46,872, respectively, and the number of patients undergoing RT with ICD-10 C00−C97 and D00−D48 was 78,583 and 7,756 respectively. The incidence of cancer and the number of patients with cancer who received RT are shown in Fig. 2. The rate of RT utilization among patients with cancer was 30.4% in 2017 and 2018 and 30.9% in 2019.

Total number of neoplasm patients who received radiotherapy in 2017, 2018, and 2019 according to the International Classification of Diseases (ICD) code in Korea.

Cancer incidence and the total number of cancer patients who received radiotherapy (RT) in 2017, 2018, and 2019 in Korea.
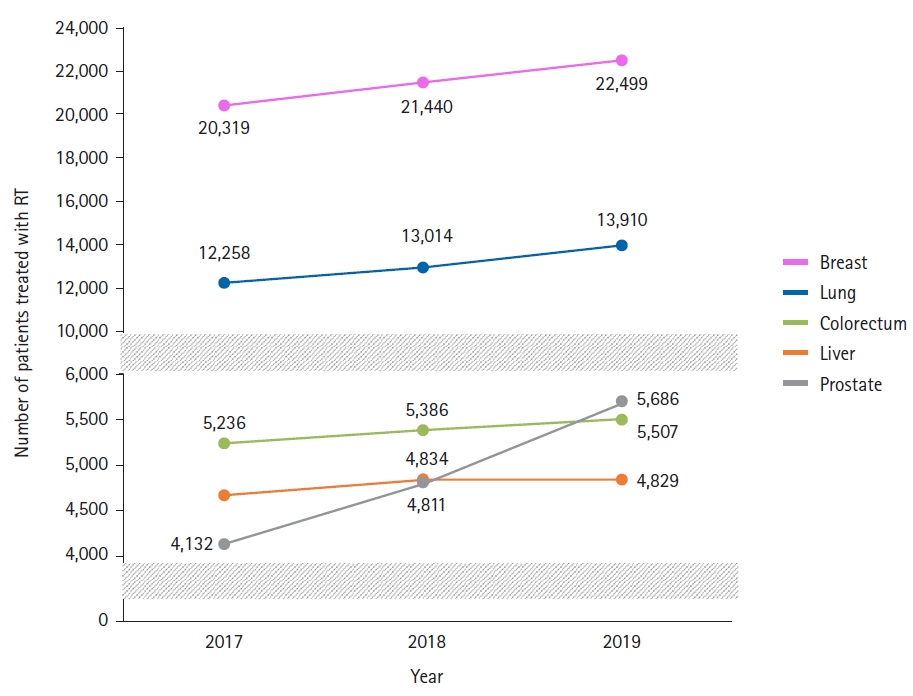
The distribution of patients treated with RT by diagnosis in 2017, 2018, and 2019 are shown in Table 1. The five most common diseases treated with RT were breast, lung, prostate, colorectal, and liver cancer in 2019 (Fig. 3). Among these cancers, the number of prostate cancer patients increased significantly by 14.1% in 2018 and 18.2% in 2019 compared to the previous year. The proportion of patients who received RT among those diagnosed with specific cancers, during the three years is shown in Fig. 4. Although the absolute number of patients with breast cancer who received RT increased, the ratio of patients with breast cancer was similar (approximately 90%) in the three years that were assessed. The RT utilization ratio for lung, colorectal, liver, prostate and uterine cervix cancer was 46.4%, 19.0%, 30.9%, 33.8%, and 77.0%, respectively.

Distribution of patients who received radiotherapy according to diagnosis in 2017, 2018, and 2019 in Korea

Utilization rate of radiotherapy (RT) for each cancer in 2017, 2018, and 2019 in Korea: (A) breast, (B) lung, (C) colorectal, (D) liver, (E) prostate, and (F) uterine cervix.
The most common types of cancers in different age groups treated with RT is depicted in Table 2. Marked differences were observed according to age. The most common cancers treated with RT are malignant neoplasms of the brain in patients <15 years of age, breast cancer in patients aged 15–64 years, and lung cancer in those aged ≥65 years. This pattern has been observed consistently since 2009 [8-10].
The utilization of RT according to specific treatment modalities between 2017 and 2019 is shown in Table 3. In 2019, the numbers of patients receiving proton therapy, brachytherapy, and SRT were 1,282, 1,492, and 12,595, respectively. The number of patients undergoing proton therapy has increased consistently since the insurance policy was changed in 2015. The proportion of patients undergoing brachytherapy remained similar in the three years from 2017 and 2019. The five most frequently treated cancer types for each treatment method are as follows: lung, secondary malignant neoplasm (unknown primary), liver, colorectal, and breast cancer with SRT; and liver, head and neck, lung, esophagus, and central nervous system cancer with proton therapy.
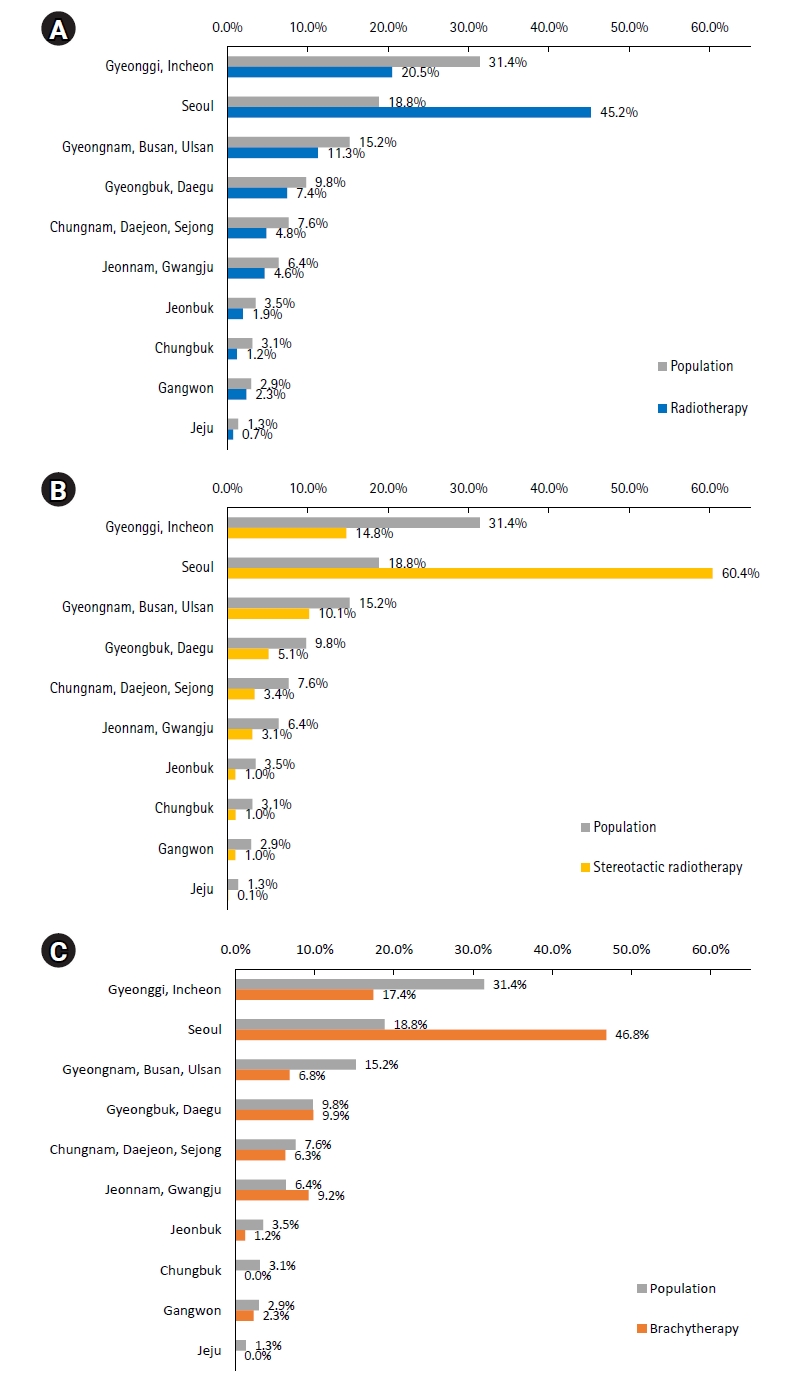
We analyzed the distribution of patients treated with RT from 2017 to 2019 in each prefecture. Although the population of Seoul comprised 18.8% of the total population, the number of patients undergoing RT in Seoul accounted for 45.2% of all patients treated with RT in 2019. This imbalance has been consistently demonstrated in previous studies [8,9]. Fig. 5 presents the proportion of overall RT, SRT, and brachytherapy performed according to region in 2019. Across treatment modalities, the proportion of patients treated in Seoul was the largest, and there was a significant difference in the utilization rate of brachytherapy by prefecture.

The proportion of treatment by prefectures in 2019: (A) overall radiotherapy, (B) stereotactic radiotherapy, and (C) brachytherapy.
The status of RT infrastructure in Korea is shown in Table 4. Provision of radiation oncology centers and overall radiotherapy equipment has steadily increased reaching 95 and 275 in 2019, showing an increase of 5.5% and 8.3%, respectively since 2017. In 2019, there were 237 megavoltage teletherapy machines, 35 brachytherapy units, two proton accelerators, and 1 kilovoltage machine. In 2019, the overall number of RT machines increased compared to 2017, and the ratio of megavoltage teletherapy machines to the population (per million) increased from 4.1 in 2017 to 4.5 in 2019. However, the number of patients treated with RT per machine also increased from 306 in 2017 to 318 in 2019. Furthermore, the number of patients with cancer per machine increased from 914 in 2017 to 926 in 2019.
Discussion and Conclusion
The total number of patients who received RT in Korea has steadily increased until 2019. Along with the change in cancer incidence, the number of prostate cancer patients who received RT has increased remarkably. Although RT infrastructure has expanded, the number of cancer patients per machine has increased from 2017 to 2019. As the demand for RT increases, the RT infrastructure should be further strengthened to provide improved care to patients.
Notes
Statement of Ethics
This study was approved by the Institutional Review Board (No. KIRAMS 2020-08-001).
Conflict of Interest
No potential conflict of interest relevant to this article was reported.
Funding
This work was supported by a grant from the Korea Institute of Radiological and Medical Sciences (KIRAMS) funded by the Ministry of Science and ICT (MSIT), Republic of Korea (No. 50571-2022).
Author Contributions
Conceptualization, EK, WIJ; Funding acquisition, WIJ, KY; Resources, KY, MSK, HJY, EKP, HJK, and JY; Supervision, EK, and WIJ; Writing of the first draft, EK; Writing the review and editing, WIJ; Formal analysis, JY; Data curation, EK, WIJ, HJK, and JY. All the authors have proofread the final version.


