


Introduction
The role of radiation therapy (RT) has evolved, with approximately 50% of cancer patients undergoing RT during treatment [1,2]. Advances in RT techniques, such as intensity-modulated radiotherapy and image-guided radiotherapy enabled conformal dose distribution and precise treatment delivery. However, individualized dose prescription based on radiation sensitivity remains challenging for radiation oncologists. A lack of biomarkers that can easily and reliably predict RT response is one of the reasons that impair precision medicine in the field of radiation oncology. Imaging biomarkers have been widely explored in the field of RT. However, in clinical practice, taking images frequently to monitor response is discouraged due to high medical costs, the risk of excessive radiation exposure, and patient inconvenience.
In this context, liquid biopsy has gained attention as a promising method for predicting response or detecting minimal disease during cancer treatment [3,4]. Circulating tumor DNA (ctDNA) refers to DNA fragments released from tumor cells and it comprises 0.1%вАУ10% of cell-free DNA (cfDNA) [5]. In cancer patients, increased cell turnover and apoptosis by tumors lead to the release of DNA fragments into the bloodstream, and more cfDNA is detected compared to the healthy population [6,7]. The previous studies suggested that the fragmentation patterns of cfDNA across the whole genome could be used for screening or monitoring treatment response in cancer patients [8]. Emerging evidence suggests the potential of ctDNA or cfDNA in monitoring treatment response or detecting minimal residual disease in cancer treatment [9,10]. However, few studies have addressed the role of cfDNA before and after RT [11].
There are various methods to analyze cfDNA as a biomarker in cancer treatment, from targeting specific mutations to profiling chromosome instabilities. Low-coverage whole genome sequencing (LC-WGS) is a rapid and practical approach for estimating chromosomal instabilities (CINs) by detecting overall chromosomal alterations across the genome. CINs are observed more frequently and affect a large scale of the genome in cancers compared to healthy controls. The potential role of CINs in predicting treatment response and tumor burden in cancer patients has been recently suggested [12-15]. As a tool for calculating genomic instabilities, the I-score, which represents CINs of cfDNA from LC-WGS data, was developed and its feasibility as a predictive biomarker for locally advanced esophageal cancer was previously described [16].
This preliminary study explored the potential feasibility of cfDNA in monitoring treatment response through the measurement of CIN using I-scores in the context of RT for other solid tumors, including esophageal cancer.
Materials and Methods
1. Study population, sample extraction, and response evaluation
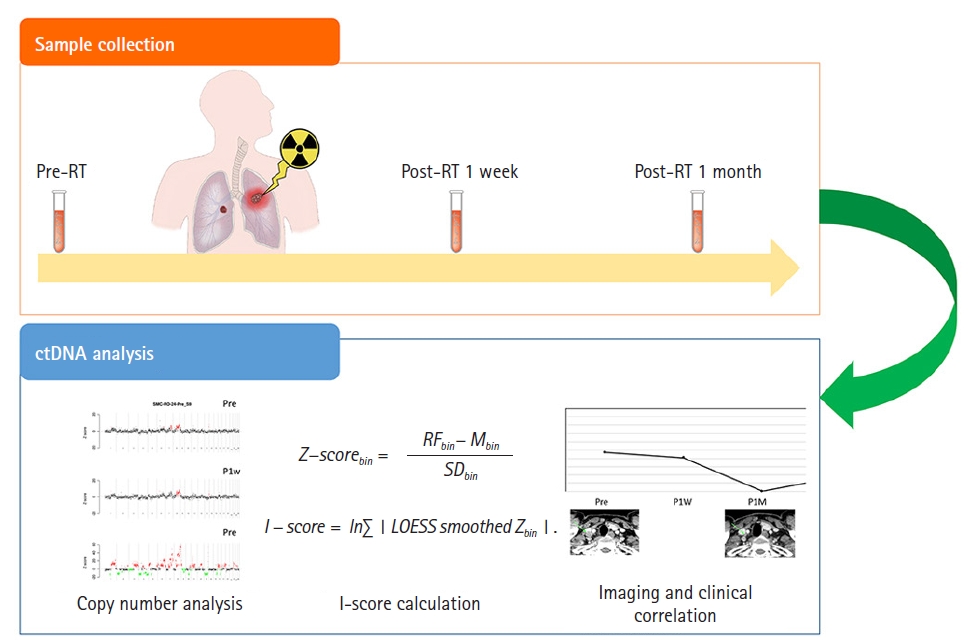
This prospective pilot study enrolled 23 patients treated with RT for lung, esophageal, and head and neck cancer after approval of the Institutional Review Board at Samsung Medical Center (No. 2019-01-104). All participants provided written informed consent prior to enrollment. Of all patients, the aim of RT was curative in 20 (87.0%) and palliative in 3 (13.0%). For serial monitoring of cfDNA, blood sampling was performed before RT, 1 week after RT, and 1 month after completion of RT (Fig. 1). One month after RT completion, treatment response was evaluated by computed tomography (CT) in 19 patients or positron emission tomography-CT scans in four patients according to the Response Evaluation Criteria in Solid Tumors (RECIST) version 1.1 [17]. Plasma samples from 358 healthy volunteers were used as negative controls and the use of this healthy control was approved by the Institutional Review Board of Green Cross Laboratories, Yongin, Korea (No. GCL-2021-1048-01).
2. cfDNA extraction and preparation
Peripheral blood samples (10 mL) from patients were collected in EDTA tubes and centrifuged within 4 hours at room temperature to isolate the plasma, and then stored at вИТ80¬∞C. DNA was extracted from plasma samples using the Chemagic cfDNA 2k kit (Perkin Elmer Inc., Waltham, MA, USA). This cfDNA was used for library preparation using the Truseq Nano kit (Illumina Inc., San Diego, CA, USA) for low-depth whole-genome sequencing. The pooled libraries of 24 samples per run were analyzed using the NextSeq 500 (Illumina Inc.) in a 75-base single-read mode. An average of 11.1 M mapped read pairs were analyzed per sample after the mapping quality filter.
3. Calculation of genome instability
Sequenced reads were aligned to the hg19 reference genome using the BWA-MEM algorithm (0.7.5.a) with default parameters. Polymerase chain reaction (PCR) duplicates were removed, and reads with mapping quality below 60 were excluded from further analysis. After splitting the whole genome into 1 Mb bins, bins located in low-mapping regions were not used for the genomic instability calculation. The relative frequency of sequencing reads mapped to each bin was calculated and corrected for GC-content bias using the LOESS algorithm [18]. To measure the patientвАЩs local instability, the Z-score was calculated by comparing the relative frequency for each bin to those of healthy control subjects. The Z-score for each bin was calculated using the following formula:
where, RFbin is the relative frequency of a bin in a patient, Mbin is the mean of the relative frequencies of a bin in normal healthy subjects, and SDbin is the standard deviation of relative frequencies of a bin in normal healthy subjects. To measure the extent of genome-wide copy number instability, we developed an I-score. A high I-score indicates a high level of genomic instability. The LOESS algorithm was applied to smooth the Z-scores of the adjacent bins. The I-score was calculated as follows:
4. I-score cutoff values
The distribution of the I-score from healthy controls is shown in Supplementary Fig. S1. The mean I-score was 4.467, and the maximum value was 6.516. The cutoff value of 5.09 was used, which is the 95th percentile value of the I-score from healthy controls.
5. Statistical analysis
Differences in I-scores at different time points were calculated using the paired Wilcoxon signed-rank test, and differences in I-scores by treatment response were assessed using the MannвАУWhitney U test and KruskalвАУWallis test. The relationship between the I-scores and gross tumor volumes was calculated using Spearman rank correlation coefficient test. All tests were two-sided and p-values <0.05 were considered statistically significant. Statistical analyses were performed using SPSS version 27.0 (IBM Corp., Armonk, NY, USA).
Results
1. Patient characteristics
A total of 23 patients were enrolled, and their characteristics are described in Table 1. The median age was 63 years (range, 46 to 74 years). The most common primary site was the lung (n = 12), followed by the esophagus (n = 5), oropharynx (n = 4), and parotid gland (n = 2). The median equivalent dose in the 2 Gy fraction was 65.0 Gy (range, 20 to 70.68 Gy) and the median gross tumor volume (GTV) was 31.3 mL (range, 0.9 to 158.1 mL). The detailed characteristics of the patients, serial values of the I-scores, and treatment responses are summarized in Supplementary Table S1.
2. Pretreatment and post-treatment values of the I-scores
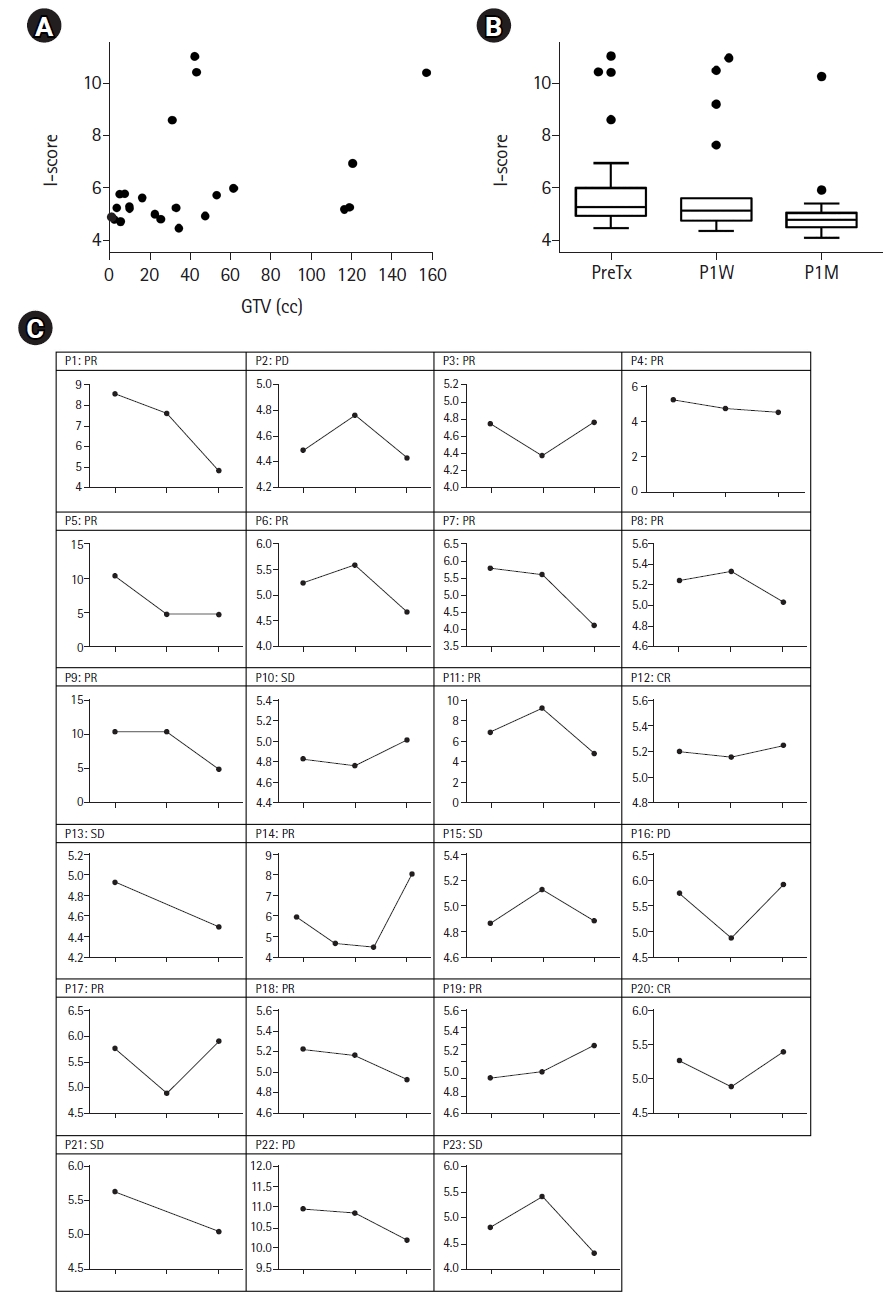
The cutoff value of 5.09 was identified from the data of the non-cancer population, and the pretreatment I-score was elevated to more than 5.09 in 17 patients (73.9%). The relationship between tumor burden and I-score was evaluated using Spearman rank correlation coefficients between the GTV and baseline I-scores (Fig. 2A). There was a significant positive correlation between the GTV and the baseline I-score (Spearman rho = 0.419, p = 0.047). The median I-scores at baseline, post-RT 1 week (P1W), and post-RT 1 month (P1M) were 5.27, 5.13, and 4.79, respectively (Fig. 2B). The I-score at P1M was significantly lower than that at baseline (p = 0.002), while the difference between baseline and P1W was not significant (p = 0.244).
Dynamic changes in the I-score at different time points in each patient are shown in Fig. 2C. At 1 week after RT, I-score was available in 21 patients (91.3%), among whom, the score decreased in 13 patients (56.5%), while it increased in eight patients (34.8%). At 1 month after RT, the I-score decreased in 16 patients (50%), while seven patients (21.9%) showed higher P1M I-scores than the baseline I-scores.
3. Relationship between the I-score and treatment response
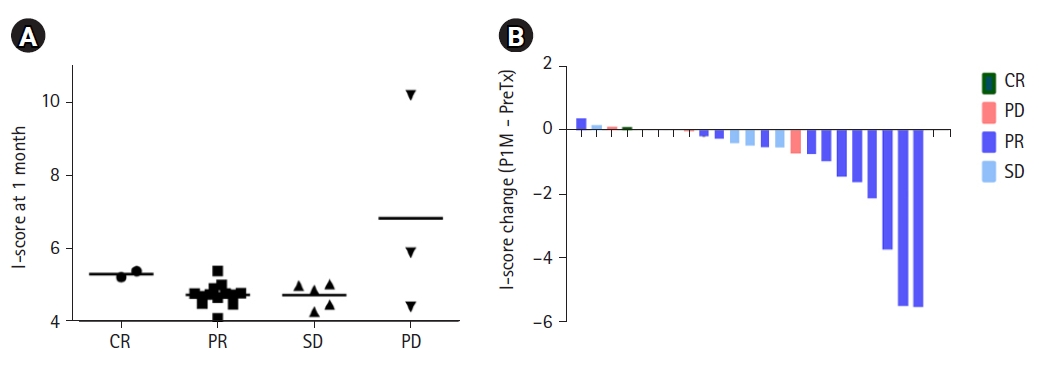
In all patients, at 1 month after RT, complete response (CR) and partial response (PR) occurred in 2 (8.7%) and 13 (56.5%) patients, respectively. Five patients (21.7%) showed stable disease (SD), and three (13.0%) experienced progressive disease (PD), all of whom experienced outfield progression.
The association between the I-scores and treatment response at 1 month after RT is shown in Fig. 3A. The median I-scores of the patients with CR, PR, SD, and PD were 5.32, 4.77, 4.89, and 5.91, respectively (p = 0.222). Even among those patients who were given curative RT, there was no statistically significant difference in median I-scores based on treatment response (Supplementary Fig. S2). Fig. 3B and Supplementary Fig. 3 show a waterfall plot of I-score changes and percentage changes from baseline at 1 month after RT.
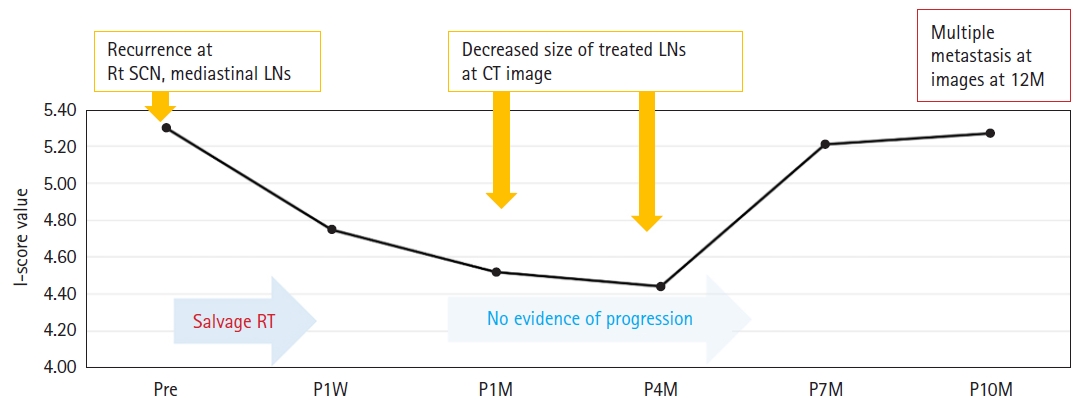
Fig. 4 shows the clinical course of a patient (P4), the only case with long-term cfDNA I-score assessment from baseline to 10 months after RT. He had been treated with salvage RT with concurrent chemotherapy for recurrent lung cancer located in the mediastinal lymph nodes and supraclavicular lymph nodes. After RT completion, a decreased size of treated LNs was observed on CT scans at 1 month and 4 months after RT. The I-score at 1 month also decreased from 5.30 at baseline to 4.52 and 4 months after RT, and further decreased to 4.44. At 7 months, the I-score increased to 5.21; however, the CT scan at 7 months did not show any evidence of disease progression. However, at 10 months, the I-score further increased to 5.27 and a slightly increased size of treated LN was detected on CT scan, and multiple disease progression developed at 12 months after RT.
Discussion and Conclusion
In this study, we evaluated the feasibility of cfDNA monitoring to predict treatment response and detect minimal residual disease after RT using the I-score calculated from LC-WGS. Emerging studies have applied different methodologies to analyze cfDNA, including next-generation sequencing cancer panels, methylation detection, whole-genome sequencing, and whole-exome sequencing [19-21]. LC-WGS is a non-targeted approach to identifying genomic instabilities and is a time- and cost-effective method. The prognostic effect of the I-score in patients with cancer has been reported previously in various solid tumors [16,22,23]. Oh et al. [22] measured I-scores in 151 patients with advanced hepatocellular carcinoma and reported that the pretreatment I-score was a significant prognostic factor for survival. Kim et al. [16] included 61 patients with esophageal cancer and showed that a higher I-score at pretreatment was associated with a poor prognosis. Woo et al. [23] also showed that the stage-adjusted I-score of cfDNA was associated with progression-free survival in patients with pancreatic adenocarcinoma.
We also measured I-scores serially to evaluate their potential role as predictors of radiation response. Of the 23 patients in this study, the pretreatment I-score was elevated by more than 5.09 in 17 patients (73.9%). Among the 17 patients, I-scores decreased in 12 patients (70.6%) at 1 week after RT and in 14 patients (82.4%) after 1 month. At 1 month, PD was observed in three patients and two of them showed elevated I-scores at 1 month. However, as shown in Fig. 3, there was no clear difference in the I-scores between the CR, PR, and SD groups. Since RT is a local modality, the response evaluation of CR, PR, and SD was performed for irradiated tumors. However, PD includes progression in non-irradiated tumors. In the cohorts of this study, disease progression was most frequently observed in unirradiated areas, and the I-score seems to be more sensitive in detecting distant recurrence. A study that analyzed patients who underwent surgery for colorectal cancer also reported that minimal residual disease using cfDNA is more useful in predicting distant recurrence than locoregional recurrence [24]. To predict the local tumor response, additional methods such as identifying radiation signatures should be explored.
We found that pretreatment I-scores tended to be higher in larger tumors, which suggests that the I-score might be a surrogate marker for tumor burden (Fig. 2). The association between larger tumor burdens and higher levels of cfDNA has also been reported in previous studies [20,25]. Another interesting finding is that minimal residual disease following RT was detected earlier by cfDNA than by imaging studies. The benefit of cfDNA analysis in identifying recurrence earlier than radiologic imaging has been well-reported in previous studies [26,27]. Similarly, in this study, the serial monitoring of the I-score in P4 case demonstrated that the change in I-score was noticed before the progression of the disease was detectable through imaging studies (Fig. 4). However, additional research with a larger population is required to fully understand the potential benefit of serial cfDNA I-score monitoring for the non-invasive detection of recurrence.
This study has several limitations. First, this study included a small number of patients with various solid tumors. The characteristics of cfDNA after RT might differ between individuals and tumor subtypes, and further studies with larger populations are needed. Second, limited sampling was performed in this study. Because of our limited financial resources, we were unable to perform serial blood samples in all patients. Serial monitoring of cfDNA at different times and a long follow-up period may be needed in future studies to find the optimal timing. Third, in 26.1% of the patients, the baseline I-score was not elevated. Lastly, the method we used does not specifically detect tumor DNA. More specific techniques to distinguish ctDNA from cfDNA might be needed to compensate for this method's limitation and improve the accuracy of liquid biopsy. Despite these drawbacks, this study investigated the feasibility of monitoring the I-score of cfDNA using LC-WGS, which is a relatively quick and simple method, and discovered several advantages and disadvantages of I-scores in predicting RT response.
In conclusion, this exploratory study has shown the feasibility of cfDNA I-score to detect minimal residual disease after RT in patients with lung cancer, esophageal cancer, and head and neck cancer. Additional studies are ongoing to optimize the measurement and analysis of cfDNA or ctDNA to predict the radiation response in cancer patients.