Association between obesity and local control of advanced rectal cancer after combined surgery and radiotherapy
Article information
Abstract
Purpose:
The association between metabolism and cancer has been recently emphasized. This study aimed to find the prognostic significance of obesity in advanced stage rectal cancer patients treated with surgery and radiotherapy (RT).
Materials and Methods:
We retrospectively reviewed the medical records of 111 patients who were treated with combined surgery and RT for clinical stage 2–3 (T3 or N+) rectal cancer between 2008 and 2014. The prognostic significance of obesity (body mass index [BMI] ≥25 kg/m2) in local control was evaluated.
Results:
The median follow-up was 31.2 months (range, 4.1 to 85.7 months). Twenty-five patients (22.5%) were classified as obese. Treatment failure occurred in 33 patients (29.7%), including local failures in 13 patients (11.7%), regional lymph node failures in 5, and distant metastases in 24. The 3-year local control, recurrence-free survival, and overall survival rates were 88.7%, 73.6%, and 87.7%, respectively. Obesity (n = 25) significantly reduced the local control rate (p = 0.045; 3-year local control, 76.2%), especially in women (n = 37, p = 0.021). Segregation of local control was best achieved by BMI of 25.6 kg/m2 as a cutoff value.
Conclusion:
Obese rectal cancer patients showed poor local control after combined surgery and RT. More effective local treatment strategies for obese patients are warranted.
Introduction
The association between cancer and metabolic effects of obesity is receiving increased attention [1-3]. Seyfried et al. [1] previously argued that cancer is a metabolic disease that evokes disturbances in cellular energy metabolism. The alterations in lipid metabolism is related tumorigenesis [4]. Many studies have recently revealed the relationship between obesity and cancer [5,6], including a prospective cohort study by Calle et al. [7] that studied the association between overweight, obesity, and cancer occurrence. Especially, obesity seems to be greatly associated with occurrence and progression of gastrointestinal cancer [7-9]. Interestingly, rectal cancer risk seems to vary with sex, according to previous studies [10-12].
For American Joint Committee for Cancer (AJCC) stage 2–3 rectal cancer patients—especially T3 or clinically node-positive patients—preoperative or postoperative radiotherapy (RT) significantly reduces the local failure rate [13]. Rectal cancer patients undergoing total mesorectal excision also showed improved local control (LC) after RT, although this improvement did not translate into a difference in survival [14]. Therefore, RT is considered the current standard therapy in locally advanced rectal cancer, and RT to the pelvis is recommended for rectal cancer patients because it can reduce the probability of local failures after surgical resection of stage 2 or 3 tumors [13,15].
Controversy remains as to whether obesity has a harmful prognostic effect in advanced stage rectal cancer patients [16]. Seishima et al. [16] previously argued that obese patients who underwent surgery showed high disease-free survival rates compared to non-obese patients. However, Park et al. [17] recently reported that obesity was associated with lower pathologic complete response rates in rectal cancer patients after neoadjuvant chemoradiotherapy. In their study, complete response was associated with better disease-free survival. Therefore, we hypothesized that obesity influenced the local treatment outcomes in patients with rectal cancer after surgery and RT. In this study, we aimed to evaluate the prognostic impact of obesity in rectal cancer, especially focusing on locally advanced stage 2–3 rectal cancer patients who underwent multimodal treatment with surgery, RT, and/or chemotherapy. In addition, the influence of diabetes mellitus (DM), which is generally related to body weight, was also evaluated.
Materials and Methods
We retrospectively reviewed the medical records of 111 patients who were treated for locally advanced rectal cancer in Inje University Busan Paik Hospital between April 2008 and August 2014. All patients who enrolled in this study were treated with radical surgery (low anterior resection or abdominoperineal resection) and perioperative (postoperative or preoperative) RT. Patients who experienced early postoperative surgical complications (i.e., anastomosis site leakage) were excluded from evaluation. In addition, patients who did not receive the full course of RT were excluded. This study was approved by the Institutional Review Board of Inje University Busan Paik Hospital.
The impact of obesity on the treatment outcome was intensively investigated. Although obesity can be evaluated clinically using several measurements including waist circumference, waist-to-hip ratio, and bioelectrical impedance, body mass index (BMI) is the more commonly used indicator for the diagnosis of obesity. BMI is easy to calculate and can be used to quantify the level of obesity. Therefore, we used BMI to evaluate obesity in the present study. Data for body weight and height were obtained from the electronic anesthesia records for the operation. Obesity was defined as a BMI ≥25 kg/m2 according to Asian BMI classification [18]. Patients were divided into the following 4 groups based on their BMI: underweight (BMI <18.5 kg/m2), normal weight (BMI 18.5–23 kg/m2), overweight (BMI 23–25 kg/m2), and obese (BMI ≥25 kg/m2). None of the patients enrolled in the study had severe obesity (BMI ≥30 kg/m2). As obesity is a predisposing factor of DM, the effect of DM on prognosis was also evaluated. To further analyze the effect of obesity on rectal cancer patients, we performed additional subgroup analyses according to patient sex.
Magnetic resonance imaging was used for evaluating the clinical stage of the cancer. For locally advanced rectal cancer, preoperative or postoperative RT was performed to reduce the local failure rate. The daily radiation dose administered was 1.8 Gy. The median total radiation dose was 50.4 Gy (range, 45 to 59.4 Gy). First, external beam RT up to 45 Gy was administered to the whole pelvic field. Whole pelvic field irradiation was performed with 10-MV photon beams by using a box field technique. For patients who were anticipated to experience local recurrence (those with mesorectal fascia invasion according to preoperative magnetic resonance imaging and/or a positive/close resection margin on pathologic reports), reduced field irradiation was added after whole pelvic irradiation. Most patients (n = 108, 97.3%) received reduced field irradiation, which was performed with a boost dose of 5.4–14.4 Gy in 3–8 fractions, with a 2-cm margin to tumor or tumor bed. Nearly half of patients (n = 58, 52.3%) treated with preoperative RT. The other patients (n = 53, 47.7%) treated with postoperative RT (Table 1).
Chemotherapy treatment mainly consisted of 5-fluorouracil (n = 75, 67.6%) (Table 1). Most patients who underwent preoperative RT were treated with concurrent chemotherapy (48/58, 82.8%). Patients who underwent postoperative RT received chemotherapy selectively (27/53, 50.9%), according to their relapse risk defined in pathologic reports.
Follow-up imaging using computed tomography was performed between two to four times a year after the treatment. Local failure was defined as anastomosis site failure, characterized by tumor regrowth in the residual rectum. Regional failure was defined as intrapelvic lymph node relapse. Distant failure was defined as extrapelvic recurrence. LC was defined as the time interval from the colonoscopic biopsy date to local failure. Recurrence-free survival (RFS) was defined as the time from the colonoscopic biopsy date to overall progression (including local failure, regional failure, and distant metastases). Overall survival (OS) was defined as the time interval from the colonoscopic biopsy date to the date of death or last follow-up. The primary endpoint of this study was LC.
For statistical analysis, SPSS ver. 18.0 (SPSS Inc., Chicago, IL, USA) was used. The Fisher exact test was used to determine the clinical factors related to treatment failure. Actuarial LC and RFS rates were estimated by using the Kaplan-Meier method. The log-rank test was used to compare clinical variables in univariate analysis. We used Cox proportional hazards model to determine the independent prognostic factors of LC. Known prognostic factors for rectal cancer, such as resection margin status and lymph node involvement were included in the multivariate analysis with Cox proportional hazard model. Statistical significance was defined as p < 0.05 (two-sided test). The maximal chi-square method used to determine which value of BMI best segregated patients into poor- and good-prognosis subgroups (in LC), with the log-rank test as the statistics used to measure the strength of the grouping. MaxStat (http://www.maxstat.de/), a maximal chi-square method in R 2.13.0 (R Development Core Team, Vienna, Austria, http://www.R-project.org) was used to identify optimal cutting points.
Results
Patient characteristics are summarized in Table 1. The median patient age was 61 years (range, 34 to 79 years), and 74 (66.7%) patients were men. The median BMI was 22.8 kg/m2 (range, 15.4 to 29.0 kg/m2), and 25 patients (22.5%) were classified as obese (BMI ≥25 kg/m2). Sixteen patients (14.4%) were preoperatively diagnosed with type 2 DM. Only one patient with DM received metformin treatment. All patients except 6 patients with mucinous carcinoma were pathologically diagnosed as adenocarcinoma. The median serum carcinoembryonic antigen (CEA) value was 3.83 ng/mL (range, 0.45 to 115.40 ng/mL). Most patients had clinical T3 disease (n = 106, 95.5%). Seventy-nine patients (71.2%) had clinically pelvic node-positive disease at preoperative evaluation. Low anterior resection was performed in 84 patients (75.7%), and abdominoperineal resection was performed in the remaining 27 patients (24.3%).
Table 2 shows the comparison of the distribution of clinical factors according to obesity (BMI ≥25 kg/m2). No clinical factors showed a significant statistical difference in distribution among either obesity or non-obesity groups.
The median follow-up was 31.2 months (range, 4.1 to 85.7 months). Treatment failure occurred in 33 patients. Local failure occurred in 13 patients (11.7%) during the follow-up period. In addition, 5 patients experienced regional lymph node failure, and 24 patients developed distant metastases. Among them, 2 patients experienced both local failure and regional lymph node failure, and 5 patients experienced both local failure and distant metastases. In addition, 4 patients experienced both regional failure and distant metastases. Among them, 2 patients experienced local failure, regional lymph node failure, and distant metastases.
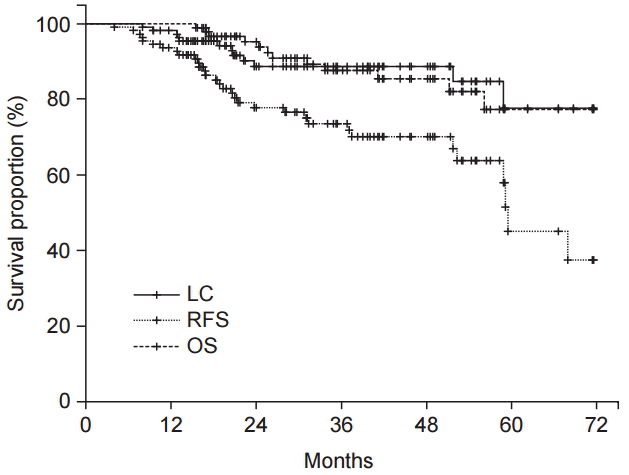
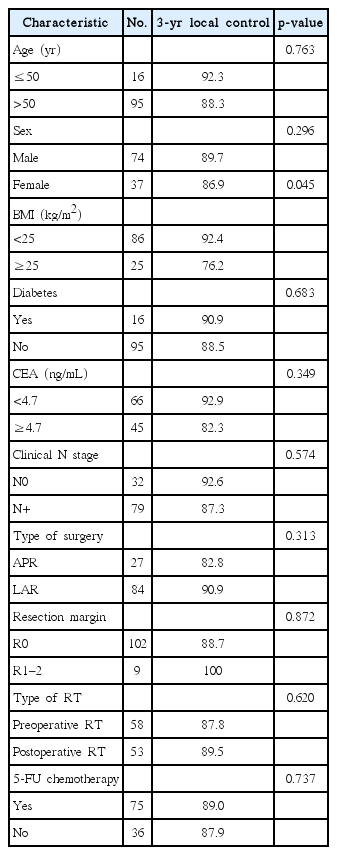
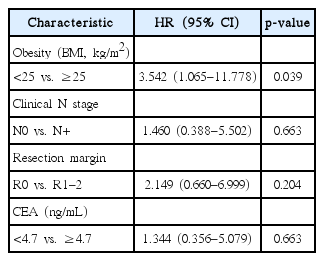
Fig. 1 shows patient LC rate. The 3-year LC was 88.7%. Table 3 shows prognostic factors for LC. LC was not affected by sex (p = 0.296) or the presence of DM (p = 0.683). LC was not affected by age (age > 50 years or age ≤ 50 years, p = 0.763). CEA level also did not affect the LC (CEA ≥ 4.7 ng/mL or CEA < 4.7 ng/mL, p = 0.349). However, reduced LC was observed in obese patients (p = 0.045). Fig. 2 show the LC rate according to obesity and BMI, respectively. Among the 25 patients with obesity, 5 patients (20.0%) experienced local failure. The 3-year LC rates were 76.2% and 92.4% for obese patients (n = 25) and non-obese patients (n = 86), respectively. Multivariate analysis identified obesity as an independent prognostic factor of LC (hazard ratio [HR], 3.542; p = 0.039) (Table 4).

Local control by (A) obesity and (B) body mass index (BMI); underweight (BMI <18.5 kg/m2), normal weight (BMI 18.5–23 kg/m2), overweight (BMI 23–25 kg/m2), and obesity (BMI ≥25 kg/m2).
The maximal chi-square method found that segregation of LC was best achieved by BMI of 25.6 kg/m2 as a cutoff value (M = 2.9672, p = 0.06309).
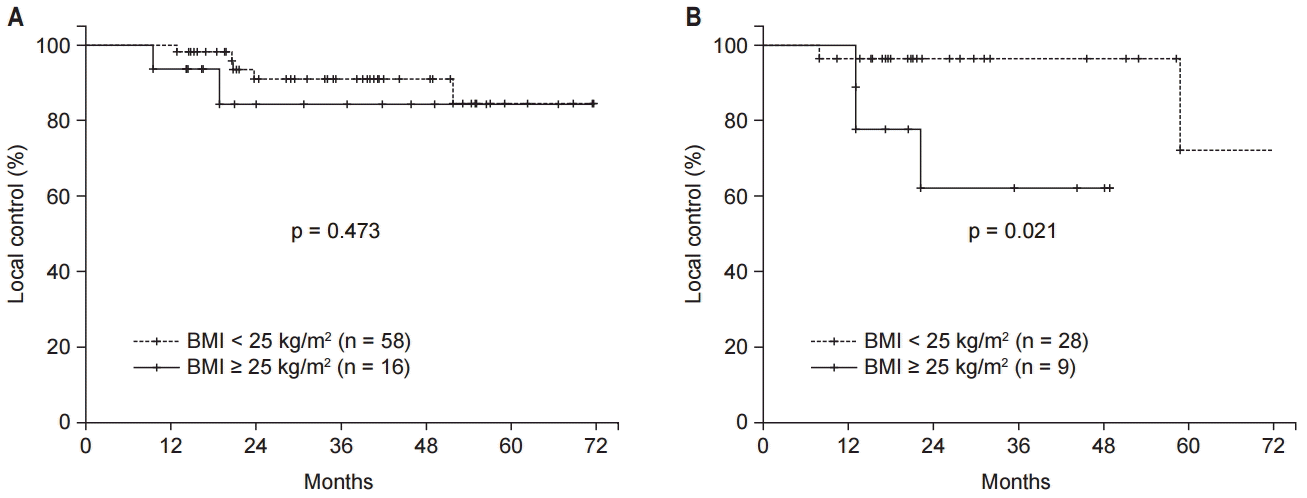
In the subgroup analysis performed according to sex, LC rates were not significantly affected by obesity in male patients (n = 74, p = 0.473) (Fig. 3A). However, LC was significantly reduced in obese compared to non-obese female patients (n = 37, p = 0.021) (Fig. 3B). In the further subgroup analysis performed according to age, old age (>50 years) did not affect the LC (p = 0.204; 3-year LC for patients >50 years, 88% vs. age ≤50 years, 100%) in male patients (n = 74). Also, old women (>50 years) did not show lower LC compared to young women (p = 0.336; 3-year LC for patients >50 years, 89.8% vs. age ≤50 years, 80%) In female patients (n = 37).
The 3-year RFS and OS rates were 73.6%, and 87.7%, respectively (Fig. 1), and were not affected by obesity (p = 0.916 and p = 0.697, respectively).
Discussion and Conclusion
Our study showed that obesity is a critical prognostic factor for LC in rectal cancer. The strategy of improving LC in these patients could bring about a better outcome.
Obesity affects not only surgical complications but also treatment outcomes in rectal cancer patients [19]. Clark et al. [20] reported that elevated visceral adiposity was associated with an increased risk of recurrence after neoadjuvant chemoradiation in rectal cancer. Our results bolster this view. For local treatment, sufficient resection of the tumor might be difficult in obese patients because of limited surgical visibility. In addition, increased set-up uncertainty during RT in obese patients might influence the treatment results. Personalized RT may improve the LC rate in obese patients. An increase in the boost dose of RT in obese rectal cancer patients should be considered to reduce local failure. Intensive systemic treatment and active secondary prevention can also reduce the risk of local recurrence in obese patients. Intensified combination chemotherapy may reduce the overall failure rate in obese patients. Close monitoring in follow-up periods could aid early detection of local recurrence and eventually result in an improved treatment outcome. Lifestyle modification and weight control have been shown to improve outcomes in rectal cancer patients [21]. Use of statins for patients who are overweight can also be considered as a treatment strategy [22].
High-calorie Western diets and low levels of physical activity have been associated with a higher prevalence of obesity. Liu and Huang [2] reported that lipids directly or indirectly activate growth promoting signals such as those involving lysophosphatidic acid, insulin, insulin-like growth factor (IGF)-1, and vascular endothelial growth factor to promote cancer cell growth. Obese persons develop insulin resistance with increased circulating levels of insulin, leading to higher circulating concentrations of IGF-1 [15]. This growth factor appears to stimulate proliferation of the intestinal mucosa [15]. Inflammatory cytokines from adipose cells are able to promote cancer proliferation [4]. Also, reduced sensitivity to antiangiogenic regimens can explain the worse cancer outcome in obesity. In addition, the PI3K/Akt/mTOR pathway, which is known to be related to both rectal cancer occurrence and lipid metabolism, is closely connected with the IGF-1 pathway [23]. Activation of the PI3K⁄Akt pathway promotes glucose uptake and its use in lipid synthesis in cancer patients [4]. A recent increase in colorectal cancer prevalence in East Asians [24] may be related to an increase in obesity caused by lifestyle or diet habit changes, which could be explained by these mechanisms. The lower LC rate seen in obese patients in our study could also be explained by these lipid-related tumorigenesis mechanisms. Moreover, targeting glycolysis by Akt pathway can eliminate the chemotherapy resistance [25]. Also, Schuurbiers et al. [26] reported that the PI3K⁄Akt pathway was related with radiation resistance mechanisms, including radio-sensitivity, hypoxia, and cancer cell proliferation.
Within the framework of LC, women were more affected by obesity compared to men in the present study. There are several possible reasons for this result. Estrogen level might affect the risk of rectal cancer relapse in women. In addition, women are generally less exposed to other environmental risk factors such as tobacco or alcohol compared to men. Therefore, the effect of obesity on recurrence might be stronger than other factors. The mechanism behind sex differences affecting the prognostic effect of obesity on LC in rectal cancer patients should be further evaluated.
Known prognostic factors, such as resection margin status, CEA level, and lymph node involvement, did not show significant prognostic effects on LC in this study. There are several possible reasons for these results. First, the adverse effect of positive resection margin was offset by RT. Second, all rectal cancer patients who underwent RT were composed of advanced-stage cancer patients. Therefore, the adverse effect of lymph node positivity was not seen this study. Finally, the relatively small sample size of this study might have obscured the statistical differences.
DM is a well-known risk factor for recurrence in colorectal cancer [27]. The negative effect of DM on rectal cancer patients’ survival was recently revealed [28]. Moreover, obesity is a well-known predisposing factor for type 2 DM. Even though our study failed to show the relationship between DM and rectal cancer local recurrence, this result may be affected by the relatively small number of patients in this study. Further large-scale of studies may confirm the effect of DM in rectal cancer local recurrence.
A limitation of this study is that we were unable to fully evaluate the effect of the dose, regimen, and number of cycles of chemotherapy on LC owing to lack of complete medical records. Thus, we cannot rule out that the obese patients might have been treated with inadequate doses of chemotherapy, which could affect LC. In regard to surgical management, obesity might increase operating time and conversion rates to operation [19]. In addition, selection bias should be taken into consideration because of the retrospective design of this study. Moreover, the prognostic effect of obesity on rectal cancer should be interpreted carefully, because of the relatively small sample size of this study.
In conclusion, obese rectal cancer patients have a lower rate of LC after combined surgery and RT compared to normal weight patients. Therefore, a more effective treatment strategy to improve LC for patients with obesity is warranted.
Notes
Conflict of Interest: No potential conflict of interest relevant to this article was reported.


