Impact of radiation dose on concurrent chemoradiotherapy for limited-stage small-cell lung cancer
Article information
Abstract
Purpose
To evaluate clinical outcomes according to radiation dose in patients with limited-stage small-cell lung cancer (LS-SCLC) treated with concurrent chemoradiotherapy (CCRT).
Materials and Methods
From January 2006 to December 2015, 38 patients with LS-SCLC were treated with CCRT with etoposide and cisplatin. Total radiation doses ranged from 45 Gy to 66 Gy (1.8–2 Gy/fraction) and were classified into three groups: 45–54 Gy, 60–63 Gy, and 66 Gy. The impact of radiation dose on survival outcomes were evaluated. Toxicities were evaluated according to the Common Terminology Criteria for Adverse Events version 4.03.
Results
The median follow-up period was 21 months. The 2-year overall survival (OS) and local failure-free survival (LFFS) rates were 45.8% and 67.5%, respectively. The 2-year LFFS rates were 33.3% for 45–54 Gy group, 68.6% for 60–63 Gy group, and 87.1% for 66 Gy group (p = 0.014). In multivariate analysis, radiation dose was a significant factor for LFFS (p = 0.015). Although radiation dose was not a significant factor for OS and disease-free survival (DFS) in multivariate analysis, both OS and DFS of 66 Gy group tended to be better than that of 45–63 Gy group in univariate analysis. However, there were no differences in severe toxicities among three groups.
Conclusion
Higher radiation dose achieved better local control in patients with LS-SCLC treated with CCRT. In addition, a total dose of 66 Gy tended to improve OS and DFS.
Introduction
Lung cancer is one of the most aggressive malignancies and the leading cause of cancer-related death. Small-cell lung cancer (SCLC) cases account for 13% of lung cancer cases, and the 5-year survival rate for SCLC is about 7% [1,2]. Two meta-analyses published in 1992 demonstrated that chemotherapy combined with thoracic radiotherapy (RT) showed moderately improved survival compared with chemotherapy alone [3,4]. In addition, in a randomized trial performed to evaluate concurrent versus sequential chemoradiotherapy, concurrent chemoradiotherapy (CCRT) showed better survival compared to the sequential arm [5]. Following these studies, CCRT has been used as a standard treatment for limited-stage SCLC (LS-SCLC).
Several studies have been performed to determine the optimal timing of the addition of RT, but the results have been controversial. Moreover, the optimal dose and fractionation of RT remain unclear. Several studies have been performed to determine the optimal radiation dose and schedule [6-11]. Compared to total dose of 45 Gy conventional RT, total dose of 45 Gy twice-daily accelerated RT over 3 weeks and doseescalated conventional RT (60–70 Gy) showed better survival outcomes [8,9,11,12]. A pooled analysis of three Cancer and Leukemia Group B trials (CALGB 30904) reported that total dose of 70 Gy with concurrent chemotherapy was feasible and tolerable [13].
Therefore, we retrospectively analyzed treatment outcomes and toxicities of patients with LS-SCLC treated with CCRT, and investigated the impact of radiation dose on survival and toxicity.
Materials and Methods
Kyungpook National University Hospital (IRB No. 2016-07-030-005) and Kyungpook National University Chilgok Hospital (No. 2016-08-023-007) approved this retrospective study and waived the requirement for informed patient consent.
1. Patients
Thirty-eight patients who were diagnosed with LS-SCLC and treated with CCRT with etoposide and cisplatin (EP) between January 2006 and December 2015 were enrolled in this study. Limited stage was defined as disease confined to a hemithorax. This included nodal disease limited to both hilum, and bilateral mediastinum. Patients with pleural or pericardial effusions and/or supraclavicular lymphadenopathy were excluded. Patients who had been treated for other malignancies before or had synchronous malignancy at diagnosis were not included. We also excluded patients who received radiation doses of less than 45 Gy or were treated with adjuvant CCRT after surgical resection.
The diagnostic workup included physical examination, bronchoscopy, sputum cytology, chest radiography, computed tomography (CT), brain magnetic resonance imaging (MRI), bone scan, and positron emission tomography/computed tomography (PET/CT). PET/CT was performed as a staging modality for all patients.
2. Chemoradiotherapy
All patients received CCRT with EP, which consisted of etoposide 100 mg/m2/day intravenously (IV) on day 1 and cisplatin 60 mg/m2/day IV on days 1 to 3. Thirty-four patients received chemotherapy of EP regimen before or after CCRT and four patients received induction chemotherapy of irinotecan plus cisplatin (CC). Total cycles of chemotherapy ranged from 1 to 7 (median, 4) and 29 patients (76.3%) received 4 or more cycles of chemotherapy. Twenty-one patients began RT simultaneously with chemotherapy from the first cycle of chemotherapy, 12 from the second cycle, 2 from the third cycle, and 3 from the fourth cycle; the former two were allocated to early CCRT group and the latter two to late CCRT group.
3. Radiotherapy
All patients underwent planning CT for three-dimensional conformal RT (3D-CRT). Gross tumor volume (GTV) included primary tumor and positive lymph nodes. Clinical target volume (CTV) included GTV with appropriate margin expansion and positive lymph node stations. Initial CTV always covered ipsilateral hilar lymph nodes and subcarinal lymph node. Elective nodal irradiation (ENI) was defined as radiation to clinically uninvolved mediastinal lymph node stations. After a radiation dose of 44–45 Gy in 1.8–2 Gy per fraction, planning CT was performed for boost treatment. Boost RT was administered to primary tumor and positive lymph nodes seen on pretreatment CT. Planning target volume (PTV) for both initial and boost RT was generated by expanding CTV with a margin of 1 cm mediolaterally and 1.5 cm craniocaudally. Total radiation dose was gradually escalated (range, 45 to 66 Gy; median, 63 Gy) and the most recently used dose was 66 Gy. Prophylactic cranial irradiation (PCI; 25 Gy in 10 fractions) was given for patients who achieved complete response (CR) or partial response (PR) after the completion of treatment.
4. Follow-up and response assessment
Posttreatment assessments were performed using physical examination, bronchoscopy, and imaging studies as needed. Follow-up imaging evaluation was generally performed within 3 months after the completion of CCRT and then every 3 to 6 months. Tumor response was evaluated based on the first follow-up chest CT after treatment according to Response Evaluation Criteria in Solid Tumors version 1.1 [14]. If patients did not undergo a CT scan within 3 months for any reason, response was evaluated based on the earliest examination performed. Brain MRI was performed for patients who either showed CR or PR with good performance status before PCI, or who showed central nervous system symptoms.
Local failure was defined as increased size of primary lesion within radiation field. Regional failure was defined as increased size of mediastinal lymph nodes or recurrence within regional lymph nodes. In-field or out-of-field recurrence was analyzed by comparing the locations of recurrence with the radiation field. When imaging findings were indeterminate, failure was determined by subsequent imaging studies and not recorded as recurrence until progression. Distant metastasis (DM) was defined as metastases in any other sites except those mentioned above. Toxicities were evaluated according to the Common Terminology Criteria for Adverse Events version 4.03 [15].
5. Statistical analysis
Radiation doses were classified into three groups: 45–54 Gy, 60–63 Gy, and 66 Gy. We evaluated overall survival (OS), disease-free survival (DFS), local failure-free survival (LFFS), regional failure-free survival (RFFS), locoregional failure-free survival (LRFFS), and distant metastasis-free survival (DMFS) according to radiation doses as primary endpoints. Survival curves were estimated by the Kaplan-Meier method from the start date of treatment until the date of event or last follow-up. Each event was defined as follows: death from any cause for OS, any locoregional or distant recurrence for DFS. Local or regional failure or DM that occurred as the patterns of initial failure was recorded as the event. When treatment failures at different sites were detected within 3 months, these failures were regarded as synchronous. The associations between survival outcomes and total radiation doses were analyzed with the log-rank test and Cox proportional hazards model. As secondary endpoints, the toxicity profiles according to radiation doses were compared. Patient characteristics and toxicities according to radiation dose were compared using Pearson chi-square test. IBM SPSS ver. 23 (IBM Corp., Armonk, NY, USA) was used for analysis, and p-values of less than 0.05 were considered statistically significant.
Results
1. Patient characteristics
Patient characteristics are summarized in Table 1. The median age was 63 years (range, 35 to 76 years). Thirty-seven patients (97.4%) were men, and 28 (73.7%) had stage III tumors. Thirty patients (78.9%) received ENI. Seventeen patients (48.6%) received PCI. The radiation doses were 45–54 Gy in 9 patients (23.7%), 60–63 Gy in 12 patients (31.6%), and 66 Gy in 17 patients (44.7%). When comparing the characteristics of patients, tumors, and treatments, all were not statistically different among three groups except the use of ENI (Table 1).

Patients’ characteristics
2. Response
The tumor responses were CR, PR, stable disease, and progressive disease in 7 (18.4%), 28 (73.7%), 1 (2.6%), and 2 (5.3%) patients, respectively. The maximal response of all patients was not different from the response based on the initial follow-up CT except in 4 patients, who showed their maximal response at 4 months after the completion of CCRT.
3. Survival and patterns of failure
The median follow-up period was 21 months (range, 4 to 119 months). All survival outcomes are shown in Fig. 1. Of the 38 patients, 14 patients (36.8%) remained alive at the time of the last follow-up. The median OS and DFS for all patients were 23 and 11 months, respectively. The 1-year and 2-year OS rates were 81.6% and 45.8%, respectively. The 1-year and 2-year DFS rates were 48.8% and 32.1%, respectively.
Survival curves. RFFS, regional failure-free survival; LFFS, local failure-free survival; LRRFS, locoregional failure-free survival; DMFS, distant metastasis-free survival; DFS, disease-free survival; OS, overall survival.
Failure patterns are shown in Table 2. Fourteen patients experienced locoregional failure(s); local in 11 patients and regional in 6 patients. The 1-year and 2-year LFFS rates were 73.6% and 67.5%, respectively. The RFFS and LRFFS rates at 2-year were 81.8% and 58.3%, respectively. No isolated regional failures were found, and Table 2 shows that in-field was a major pattern of failure.
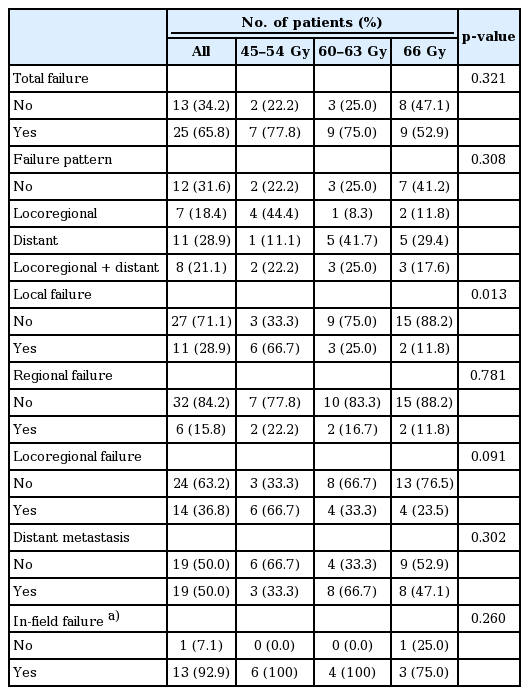
Patterns of initial failure
Nineteen patients experienced DM with simultaneous locoregional failure in 8 patients. The 1-year and 2-year DMFS rates were 59.4% and 47.7%, respectively. The common sites of DM were brain (n = 9), bone (n = 8), liver (n = 7), adrenal glands (n = 4), pleura (n = 4), abdominal lymph node (n = 4), and contralateral lung (n = 2).
4. Survival outcomes according to total radiation dose
Survival differences according to radiation doses are shown in Fig. 2. Higher radiation dose significantly improved LFFS (p = 0.014) and tended to improve LRFFS (p = 0.094). However, there was no difference in RFFS. Even though there was no statistical difference in OS and DFS among three groups, 66 Gy group achieved better survival than other groups; when patients were divided into two groups (45–63 Gy vs. 66 Gy), there was a borderline significance in both OS (p = 0.086) and DFS (p = 0.097).
Survival curves according to total radiation doses: (A) overall survival, (B) local failure-free survival, (C) regional failure-free survival, and (D) locoregional failure-free survival.
5. Factors associated with survival
The results of univariate and multivariate analyses for survival outcomes are summarized in Table 3.

Univariate and multivariate analysis of survival outcomes
Radiation dose was a significant factor for LFFS in both univariate (p = 0.014) and multivariate analyses (p = 0.015), and had marginal significance for LRFFS (p = 0.081) in multivariate analysis. Achieving response was a significant factor for LFFS (p = 0.046), RFFS (p = 0.019), and LRFFS (p = 0.007) in univariate analysis, which maintained significance for LRFFS (p = 0.041) in multivariate analysis. Receiving PCI was a significant factor for DMFS (p = 0.011) and had marginal significance for OS (p = 0.066) and DFS (p = 0.091). However, there were no factors associated with RFFS.
6. Toxicity
The most common toxicities were acute esophagitis and radiation pneumonitis. Acute esophagitis was defined as dysphagia observed during RT or within 1 month after the completion of RT. Twenty-one patients showed acute esophagitis, and 13 had grade 2 toxicity. There was no grade 3 or higher acute esophagitis. Among 35 patients with radiation pneumonitis, 33 patients experienced grade 1–2 toxicity and 2 had grade 5 toxicity. Late lung fibrosis was determined 6 months after the completion of RT; only grade 1 toxicity was observed in 33 patients. Grade 3 and 5 febrile neutropenia occurred in 3 patients. Grade 5 aspiration pneumonia was observed in 1 patient. There were no statistical differences in observed toxicities according to radiation dose (Table 4).
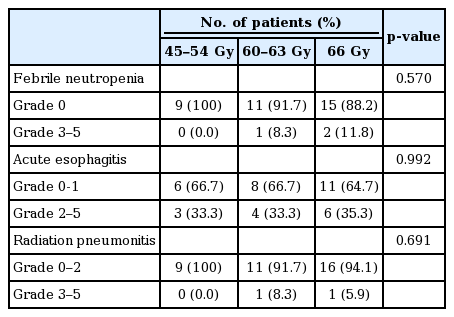
Treatment-related toxicities
Discussion and Conclusion
In the present study, we analyzed treatment outcomes according to radiation dose in patients with LS-SCLC treated with CCRT. Radiation dose was a significant prognostic factor for local control in multivariate analysis, but not with regional control. Even though radiation dose was not a prognostic factor for OS and DFS in multivariate analysis, a total dose of 66 Gy tended to improve OS and DFS
The optimal radiation dose and fractionation have not yet been determined. In the phase II study by the Southwest Oncology Group, 45 Gy once-daily CCRT achieved a median survival of approximately 18 months and a 2-year survival rate of 40% with acceptable toxicities [16]. Because the dose-response curve for SCLC cells had no shoulder when studied in vitro, a relatively lower dose hyperfractionated RT regimen was performed to reduce the toxicities to normal organs [8]. A pilot study conducted by the Eastern Cooperative Oncology Group showed that twice-daily thoracic RT resulted in no differences in efficacy and toxicities compared to standard fractionation RT [9]. Based on the results of previous studies, the Intergroup 0096 was conducted to compare 45 Gy in 1.8 Gy once daily to 45 Gy in 1.5 Gy twice daily, and reported that accelerated twice-daily RT showed superior survival [17]. As a result, a twice-daily regimen of 45 Gy has become a standard regimen for LS-SCLC.
However, because the biological effective dose of once-daily RT is not the same as that of twice-daily RT when considering total RT duration, and the rate of in-field recurrence has continued to be high despite the use of CCRT, many dose escalation studies have been performed [11,12]. The Radiation Therapy Oncology Group (RTOG) 9712 trial showed an improvement in survival with dose escalation up to 61.2 Gy in 1.8 Gy per fraction [12]. Another phase I study (CALGB 8837) showed that the maximum tolerated radiation dose of CCRT was 45 Gy in 30 fractions over 3 weeks for twice-daily RT and 70 Gy in 35 fractions over 7 weeks for once-daily RT [11]. In this study, there was no difference in survival between the once-daily RT group and the twice-daily RT group; however, no analysis was performed regarding the dose-response relationship. In a pooled analysis of subsequent CALGB studies (39808, 30002, and 30206) using 70 Gy in 35 fractions, 2-year OS and progression-free survival rates were 20% and 26%, respectively, which were comparable to those of the Intergroup 0096 study [13]. Based on these results, two phase III randomized studies (CALGB 30610 and CONVERT) are ongoing to clarify the optimal radiation dose [18,19]. CALGB 30610 randomly assigned patients to receive 45 Gy in 1.5 Gy twice daily, 70 Gy in 2 Gy once daily, or 61.2 Gy in 1.8 Gy per fraction with accelerated fractionation [18]. The interim analysis showed that the median survival times were 21.5, 21.5, and 20.2 months with no significant difference in OS (p = 0.631). After the interim analysis, a dose schedule of 61.2 Gy in 34 fractions was discontinued because of the greatest toxicities. The survival results comparing 70 Gy in 2 Gy once daily versus 45 Gy in 1.5 Gy twice daily will be available after several years. Another phase III randomized study, the CONVERT trial, is comparing 66 Gy in 2 Gy once-daily RT with 45 Gy in 1.5 Gy twice-daily RT. Recently, it reported no survival differences at a median follow-up of 45 months with similar toxicity profiles [19].
Although 45 Gy in 1.5 Gy twice daily with concurrent chemotherapy is the only treatment schedule that has been confirmed by a randomized trial, only a once-daily RT schedule has been applied in Korea because twice-daily RT has not been reimbursed by the national health insurance system. Furthermore, it is still necessary to determine the optimal radiation dose with daily fractionated RT when considering the following results. An early study from Massachusetts General Hospital showed that a higher total dose achieved higher locoregional control within the range of 30 Gy to 50 Gy [20]. In a later study from the same hospital reporting the results in patients treated with ≥50 Gy, the higher dose group (55–72 Gy, median 63 Gy) tended to achieve a higher DMFS although there were no differences in OS, local control, or DFS between the two groups (50–54 Gy vs. 55–72 Gy) [6]. The current study showed a positive dose-response relationship in local control (45–54 Gy vs. 60–63 Gy vs. 66 Gy) (Fig. 2, Table 3). In a Japanese retrospective study, the higher dose group (54–66 Gy) achieved significantly better local control and OS compared to the lower dose group (<54 Gy) [7]. In addition, long-term survival data from CALGB 8837 showed better median survival and 5-year OS in the daily fractionated RT arm compared to the twice-daily RT arm [21].
Dose escalation may be associated with better survival but could jeopardize survival by simultaneously increasing toxicities. Rutter et al. [22] evaluated dose escalation in SCLC with CCRT. For patients treated with radiation doses of 30.01 to 70 Gy, median OS increased and HR decreased in accordance with the increase in total radiation dose; these findings were statistically significant. However, OS in patients treated with radiation doses of over 70 Gy (70.01–80 Gy) was inferior compared with that of patients treated with radiation doses of 40.01 to 70 Gy. Salama et al. [23] analyzed predictors of pulmonary toxicity in 100 patients with LS-SCLC treated with CCRT of 70 Gy. Grade 3 pulmonary toxicity was observed in 3 patients (3%), and its likelihood was associated with the volume of lung irradiated with lower, intermediate, and higher radiation doses. As 3D-CRT or intensity-modulated RT has come into wide use recently, it has become possible to escalate the radiation dose more safely than in the past. The toxicity profiles of the current study showed that high-dose radiation of 66 Gy using 3D-CRT did not increase the acute and late radiation-induced toxicities when compared to a lower dose radiation. However, radiation-induced lung toxicities should be carefully considered when using high-dose radiation, considering two cases of grade 5 radiation pneumonitis in 29 patients receiving 60–66 Gy.
Several prospective randomized and retrospective studies have demonstrated that the omission of ENI was not associated with isolated nodal recurrence; in-field recurrence was a major failure pattern [24-27]. In the current study, in-field recurrence occurred in 92.9% of the patients with locoregional failures and radiation dose was a significant factor for LFFS in multivariate analysis. Therefore, dose escalation to the gross tumor without ENI could be a strategy to improve both locoregional control and DFS without increasing toxicities.
This study has some limitations as a retrospective study with a small number of patients. Because of the long period of enrollment for patients, treatment volume, the implementation of PCI, and chemotherapeutic regimen have changed. The characteristics of patients and tumors should be heterogeneous. Because the radiation dose has increased gradually, the follow-up period of patients treated with higher doses was shorter. All of these factors can serve as causes of bias. Furthermore, assessment of toxicities was difficult because they were obtained by retrospective chart review.
In summary, higher radiation dose was associated with better local control and high-dose radiation of 66 Gy tended to improve OS and DFS. Because the follow-up period of 66 Gy group was short, long-term follow-up is needed to know the impact of radiation dose on OS and DFS. Although there are some limitations due to its nature as a retrospective study, the results of the present study imply the possibility of high-dose radiation in the treatment of LS-SCLC.
Notes
Conflict of Interest: No potential conflict of interest relevant to this article was reported.