Tumor volume/metabolic information can improve the prognostication of anatomy based staging system for nasopharyngeal cancer? Evaluation of the 8th edition of the AJCC/UICC staging system for nasopharyngeal cancer
Article information
Abstract
Purpose
We evaluated prognostic value of the 8th edition of the American Joint Committee on Cancer/International Union for Cancer Control (AJCC/UICC) staging system for nasopharyngeal cancer and investigated whether tumor volume/metabolic information refined prognostication of anatomy based staging system.
Materials and Methods
One hundred thirty-three patients with nasopharyngeal cancer who were staged with magnetic resonance imaging (MRI) and treated with intensity-modulated radiotherapy (IMRT) between 2004 and 2013 were reviewed. Multivariate analyses were performed to evaluate prognostic value of the 8th edition of the AJCC/UICC staging system and other factors including gross tumor volume and maximum standardized uptake value of primary tumor (GTV-T and SUV-T).
Results
Median follow-up period was 63 months. In multivariate analysis for overall survival (OS), stage group (stage I-II vs. III-IVA) was the only significant prognostic factor. However, 5-year OS rates were not significantly different between stage I and II (100% vs. 96.2%), and between stage III and IVA (80.1% vs. 71.7%). Although SUV-T and GTV-T were not significant prognostic factors in multivariate analysis, those improved prognostication of stage group. The 5-year OS rates were significantly different between stage I-II, III-IV (SUV-T ≤ 16), and III-IV (SUV-T > 16) (97.2% vs. 78% vs. 53.8%), and between stage I, II-IV (GTV-T ≤ 33 mL), and II-IV (GTV-T > 33 mL) (100% vs. 87.3% vs. 66.7%).
Conclusion
Current anatomy based staging system has limitations on prognostication for nasopharyngeal cancer despite the most accurate assessment of tumor extent by MRI. Tumor volume/metabolic information seem to improve prognostication of current anatomy based staging system, and further studies are needed to confirm its clinical significance.
Introduction
Nasopharyngeal cancer has been considered different from other head and neck cancers in aspects of natural history and treatment strategy, and the American Joint Committee on Cancer/International Union for Cancer Control (AJCC/UICC) staging system has provided a distinct staging classification for nasopharyngeal cancer since 5th edition. Staging system provides information for the disease status and has been used to communicate with others, guide treatment decision, predict prognosis, and evaluate treatment results. With advances in diagnostic and therapeutic technology, the clinical significance of the staging system can be changed. During the past two decades, there has been three major advances for nasopharyngeal cancer. First, more accurate assessment of tumor extent has been possible by magnetic resonance imaging (MRI). Second, concurrent chemoradiotherapy has been used for locoregionally advanced disease. Third, dose distribution for tumor as well as organs at risk have been improved by intensity-modulated radiation therapy (IMRT). The overall survival (OS) rates were reported from 83% to 94% at 3 years and 88% at 4 years in patients who treated with IMRT in the contemporary series [1-5].
The new 8th edition of the AJCC/UICC staging system for nasopharyngeal cancer has been proposed based on extensive literature review for the contemporary patients, and Pan et al. [6] validated prognostic value of the 8th edition of the AJCC/UICC staging system in 1,609 patients who were staged with MRI and treated with IMRT at two major centers in Hong Kong and mainland China. However, the prognostic value of the 8th edition of the AJCC/UICC staging system for nasopharyngeal cancer has not been evaluated outside China yet. In addition, the 8th edition of the AJCC/UICC staging system for nasopharyngeal cancer is entirely based on the anatomic extent. Therefore, the purpose of present study was (1) to evaluate the prognostic value of the 8th edition of the AJCC/UICC staging system in our institution which located outside of China, (2) to investigate whether tumor volume/metabolic information refined the prognostication of current anatomy based staging system in nasopharyngeal cancer.
Materials and Methods
1. Patient
We retrospectively reviewed the records of 224 patients with pathologically proven nasopharyngeal cancer who treated with IMRT at Asan Medical Center between January 2004 and December 2013. Of 224 patients, 91 patients were excluded for the following reasons: (1) no pretreatment MRI evaluation (n = 69); (2) distant metastasis at diagnosis (n = 5); (3) a history of previous malignancy other than skin cancer (n = 7); (4) a history of previous radiotherapy (n = 1); (5) a short follow-up period of less than 6 months (n = 4); or (6) age <18 years (n = 5). The remaining 133 patients, who were staged with MRI and treated with IMRT, were included in the present study (Table 1). This study was approved by the Institutional Review Board of Asan Medical Center (No. 2017-0731).
2. Clinical staging
Pretreatment evaluations included medical history, physical examination, laboratory tests, fiberoptic nasopharyngoscopy with biopsy, MRI of the head and neck, and chest radiography. An additional 18F-fluorodeoxyglucose positron emission tomography (18F-FDG PET) evaluation was performed in 110 patients. All patients were re-staged according to the 7th and 8th edition of the AJCC/UICC staging system after reviewing pretreatment evaluations including MRI. The pretreatment MRI findings were retrospectively reviewed by a board-certified radiation oncologist (Y. Jeong), and any disagreements with the original clinical MRI reports were resolved by consensus with a board-certified radiation oncologist (S. Lee) specialized in head and neck cancers.
3. Treatment and follow-up
The treatment details were described in our previous reports [7,8]. All patients were treated with IMRT with 6- or 15-MV photon beams from a linear accelerator (Varian Medical Systems, Palo Alto, CA, USA). Total radiation dose for the primary nasopharyngeal lesion and the involved lymph nodes (LN) was median 70 Gy (range, 50 to 72.6 Gy). CT simulation was performed for all patients with a slice thickness of 2.5 or 5 mm. The gross tumor volume of primary tumor (GTV-T) was defined as the primary nasopharyngeal lesion according to the pretreatment evaluations. The GTV-T of original treatment plans were available in 85 patients who were treated after 2006, and automatically calculated by Eclipse treatment planning system (Varian Medical Systems). In 124 patients (93%), concurrent chemotherapy with cisplatin (n = 122) or cetuximab (n = 2) was delivered during radiotherapy. Induction or adjuvant chemotherapy was performed in 31 (23%) and 7 patients (5%), respectively, with various combination regimens with cisplatin (Table 1). During treatment, patients were interviewed weekly with evaluations including complete blood count, body weight, and a physical examination.
4. Follow-up and statistics
One month after completion of radiotherapy, evaluations including physical examination and fiberoptic nasopharyngoscopy with or without CT, MRI, or 18F-FDG PET were performed. The patients were followed up periodically with 3-month intervals for the first 3 years and every 6 months or 1 year thereafter. The OS, distant metastasis-free survival (DMFS), and local recurrence-free survival (LRFS) rates were estimated from the date of the start of radiotherapy to the date of death from any cause or last follow-up, to the date of distant metastasis or last follow-up, to the date of local recurrence or last follow-up, respectively, by the Kaplan-Meier method. Univariate and multivariate analyses were performed to evaluate prognostic value of the AJCC/UICC staging system and other factors including gross tumor volume and maximum standardized uptake value of primary tumor (GTV-T and SUV-T), and log-rank tests were performed to compare survival outcomes. The optimal cut-off point of the GTV-T and SUV-T was determined by the R software package “maxstat”, and the value with the smallest p-value for survival rates in the log rank statistics was chosen for the analysis. Multivariate Cox proportional hazards models were built with variables with p-values of <0.1. All statistical tests were two-sided and performed at the 5% level of significance using SPSS version 21.0 (SPSS Inc., Chicago, IL, USA) and R software version 3.3.2 (R Foundation for Statistical Computing, Vienna, Austria; https://www.r-project.org).
Results
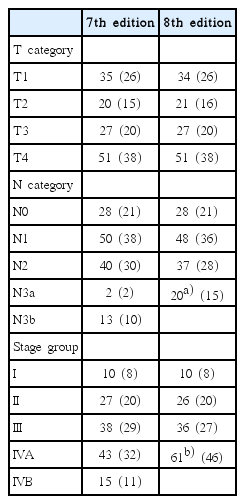
Patient characteristics are summarized in Table 1. The stage groups were I, II, III, and IVA in 8%, 20%, 27%, and 46% of patients, respectively, according to the 8th edition of the AJCC/UICC staging system (Table 2). The changes from 7th edition to the 8th edition of the AJCC/UICC staging system were as followings: (1) upstaging from T1 to T2 (n = 1) due to adding prevertebral muscle involvement as T2 criteria; (2) upstaging from N1 to N3 (n = 2) and N2 to N3 (n = 3) due to replacing N3b criteria to the extension below the caudal border of the cricoid cartilage; (3) merging N3a to N3 (n = 2) and N3b to N3 (n = 13); (4) upstaging from II to IVA (n = 1) and III to IVA (n = 2) due to the changes in N categories; (5) merging stage IVB to IVA (n = 15). The GTV-T and SUV-T were median 19.5 mL (range, 0.7 to 118.2 mL) and 8.7 (range, 1.8 to 24.9), respectively.

Distribution of T category, N category, and stage group as defined by the 7th and 8th edition of AJCC/UICC staging system for nasopharyngeal cancer
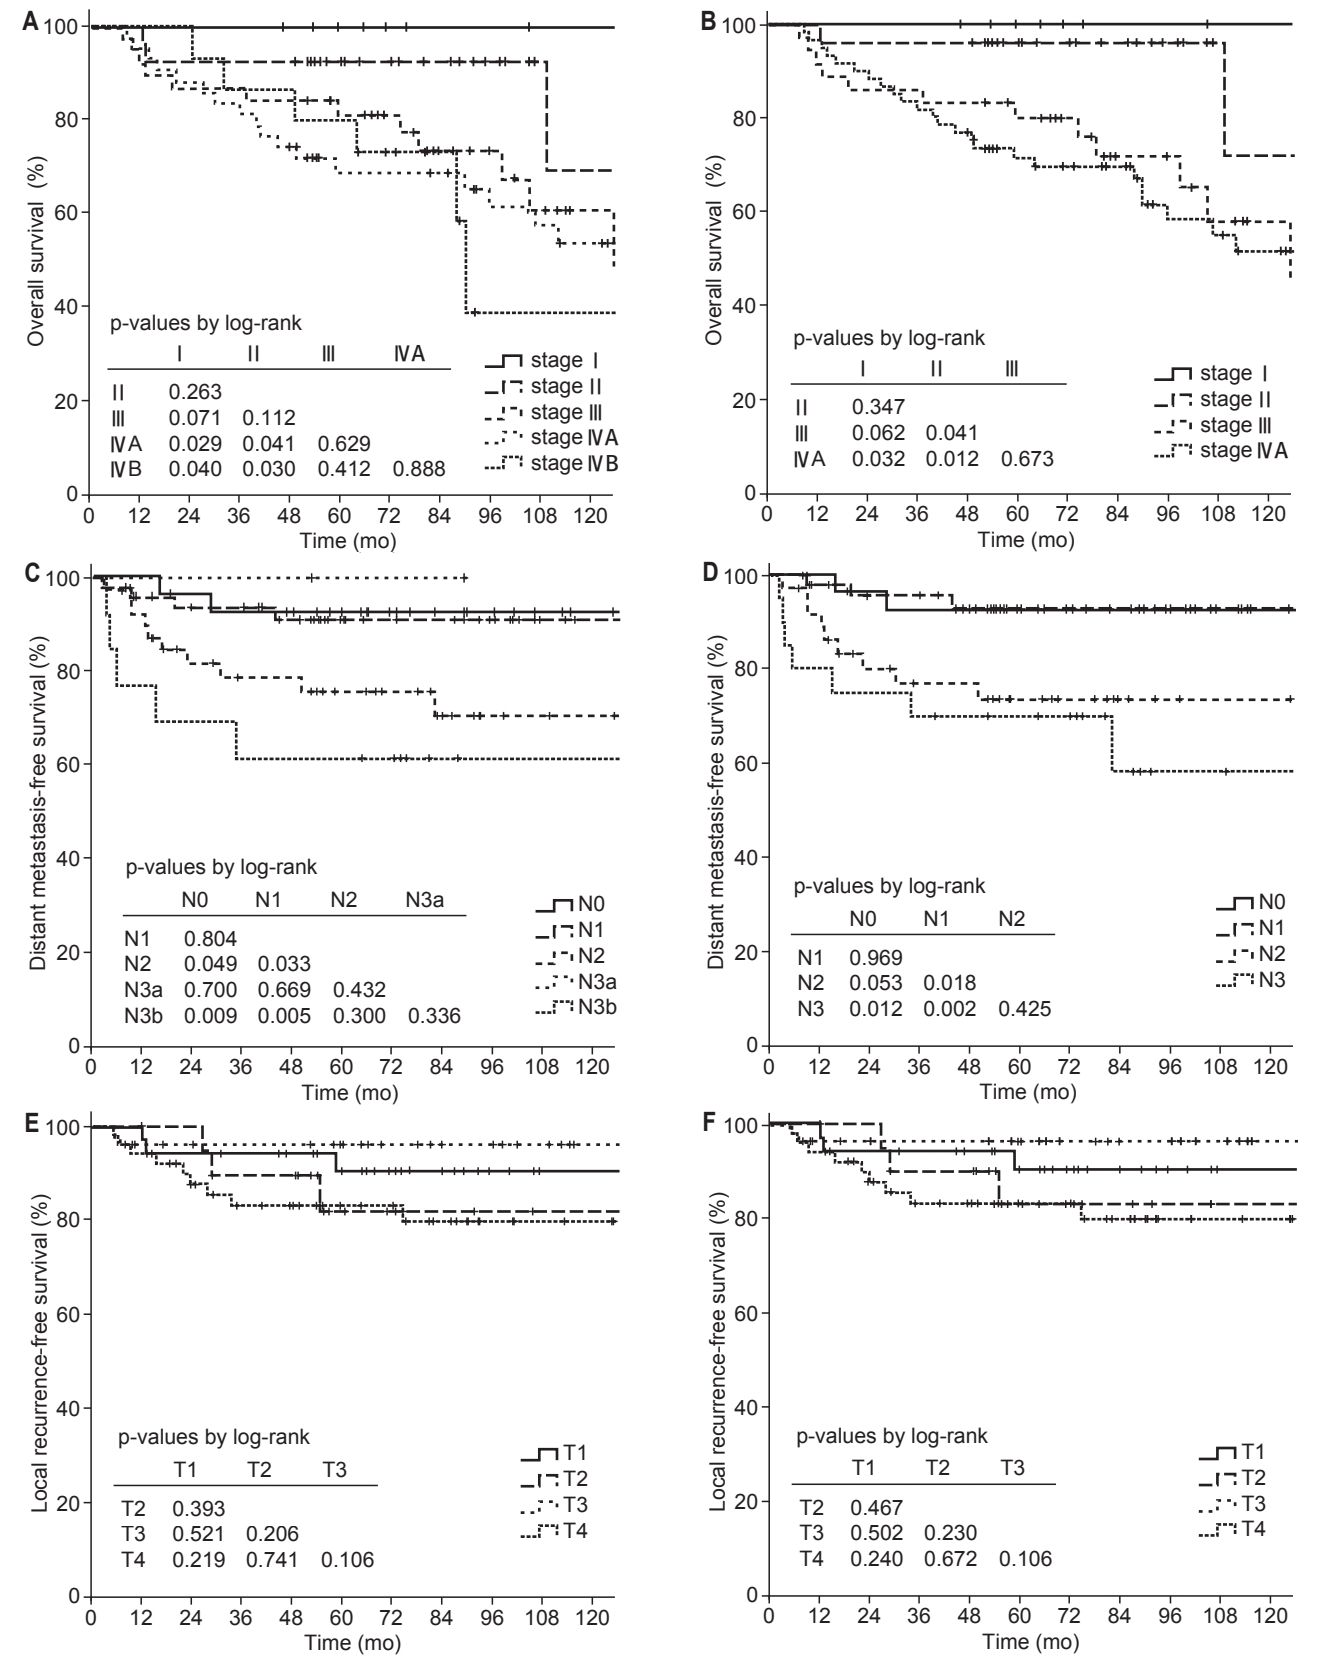
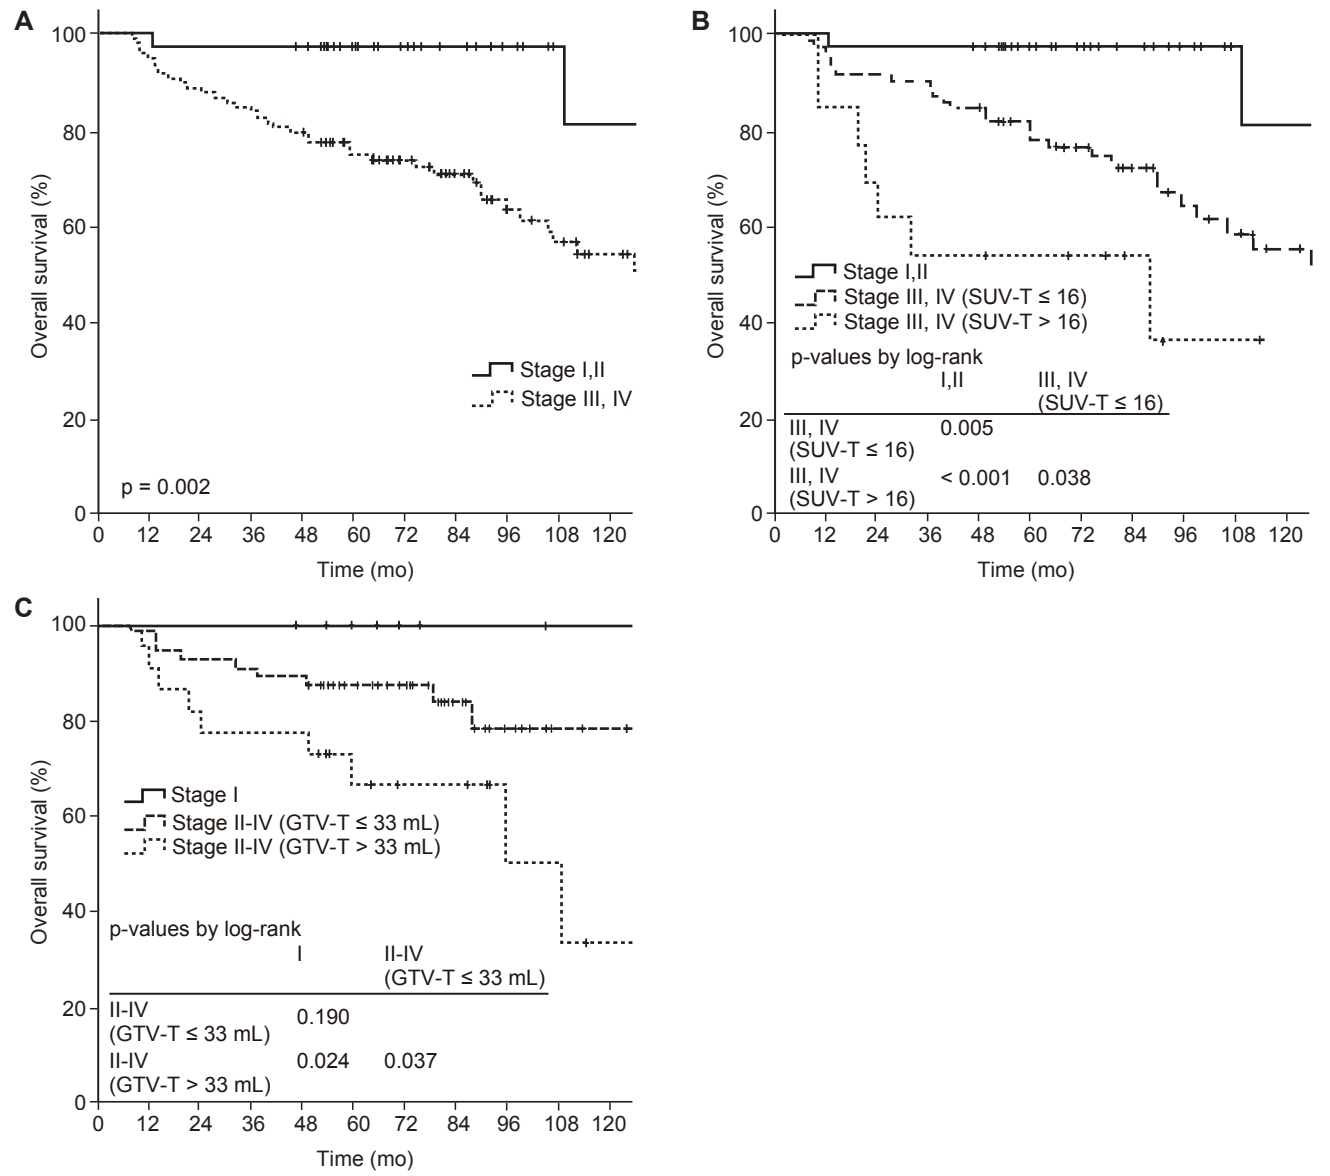
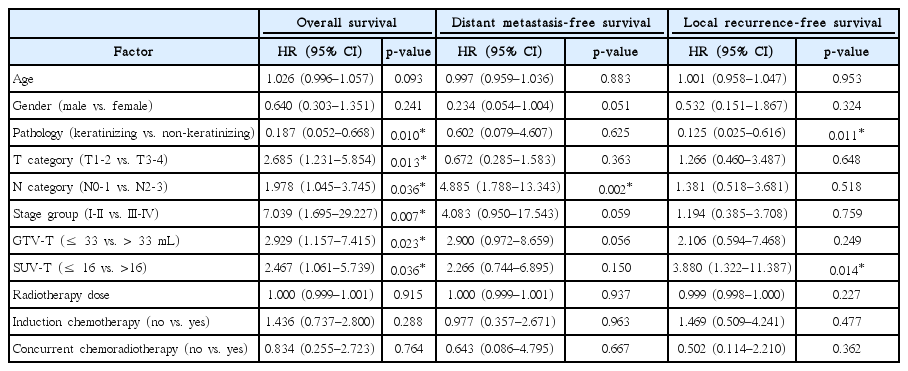
The follow-up period was median 63 months (range, 7.2 to 155.8 months), and the 5-year OS, DMFS, and LRFS rates were 80.8%, 84.1%, and 87.5%, respectively. According to the 7th edition of the AJCC/UICC staging system, 5-year OS rates were 100%, 92.6%, 81.2%, 68.8%, and 80% for stage I, II, III, IVA, and IVB, respectively, and the differences between stage I and II (p = 0.263), II and III (p = 0.112), III and IVA (p = 0.629), and IVA and IVB (p = 0.888) were not statistically significant (Fig. 1A). According to the 8th edition of the AJCC/UICC staging system, 5-year OS rates were 100%, 96.2%, 80.1%, and 71.7% for stage I, II, III, and IVA, respectively, and differences between stage I and III (p = 0.062), I and IVA (p = 0.032), II and III (p = 0.041), and II and IVA (p = 0.012) were statistically significant or marginally significant (Fig. 1B). In univariate analysis, stage group as well as age, pathology, GTV-T, and SUV-T were significant prognostic factors for OS (Table 3). In multivariate analysis, stage group (I-II vs. III-IVA) was the only significant prognostic factor for OS (hazard ratio [HR] = 11.062; 95% confidence interval [CI], 1.442–84.863; p = 0.017). However, there was no significant difference in OS rates between stage I and II (p = 0.347), and III and IVA (p = 0.673) (Fig. 1B). Although SUV-T and GTV-T were not significant prognostic factors for OS in multivariate analysis, the incorporation of SUV-T and GTV-T into stage group improved prognostication of stage group. The OS rates were significantly different between stage I-II, III-IV (SUV-T ≤ 16), and III-IV (SUV-T > 16) (5-year OS, 97.2% vs. 78% vs. 53.8%, p < 0.001) (Fig. 2A, 2B). In addition, OS rates were also significantly different between stage I, II-IV (GTV-T ≤ 33 mL), II-IV (GTV-T > 33 mL) (5-year OS, 100% vs. 87.3% vs. 66.7%, p = 0.021) (Fig. 2C).

Overall survival (A, B), distant metastasis-free survival (C, D), local recurrence-free survival (E, F) rates according to the 7th (A, C, E) and 8th (B, D, F) edition of AJCC/UICC staging system for nasopharyngeal cancer. AJCC/UICC, the American Joint Committee on Cancer/International Union for Cancer Control.

Overall survival rates according to the stage group alone(A), risk groups according to the stage group and SUV-T (B), andrisk groups according to the stage group and GTV-T (C). SUV-T,maximum standardized uptake value of primary tumor; GTV-T,gross tumor volume of primary tumor.
The 5-year DMFS rates according to the N category of the 7th and 8th edition of the AJCC/UICC staging system are shown in Fig. 1C and 1D, respectively. According to the 8th edition of the AJCC/UICC staging system, 5-year DMFS rates were 92.7%, 92.9%, 73.7%, and 70.0% for N0, N1, N2, and N3, respectively, and differences were statistically significant or marginally significant between N0 and N2 (p = 0.053), N0 and N3 (p = 0.012), N1 and N2 (p = 0.018), and N1 and N3 (p = 0.002) (Fig. 1D). However, in both 7th and 8th edition, the differences between N0 and N1, and N2 and N3 were not statistically significant. In univariate analysis, N category (N0-1 vs. N2-3) was statistically significant for DMFS, and gender and GTV-T were marginally significant (Table 3). In multivariate analysis, N category (HR = 5.869; 95% CI, 2.139–16.104; p = 0.001) and gender (HR = 0.176; 95 CI, 0.041–0.760; p = 0.020) were significant prognostic factors for DMFS.
In univariate analysis for LRFS, pathology and SUV-T were significant prognostic factors, but T category was not (Table 3). According to the T category of the 8th edition of the AJCC/UICC staging system, 5-year LRFS rates were 90.4%, 83.1%, 96.3%, and 83.2% for T1, T2, T3, and T4, respectively, and no significant difference was observed between T categories according to the 8th edition as well as the 7th edition of the AJCC/UICC staging system (Fig. 1E, 1F). Patients with T4 category had inferior LRFS than that in patients with T1-3 category, but the difference was not statistically significant (5-year LRFS, 90.1% vs. 83.2%, p = 0.113). In multivariate analysis for LRFS, pathology (HR = 0.104; 95% CI, 0.021–0.519; p = 0.006) was the only significant prognostic factor, and 5-year LRFS rates were 66.7% and 90.3% for keratinizing and non-keratinizing carcinoma, respectively (Fig. 3A). Although SUV-T was not a significant prognostic factor for LRFS in multivariate analysis, 5-year LRFS rates were marginally different depending on the SUV-T in the subgroup analysis for non-keratinizing carcinoma (SUV-T ≤16 vs. >16, 92.0% vs. 67.3%, p = 0.051) (Fig. 3B). In addition, in the subgroup analysis for T2-4 categories, 5-year LRFS rates were significantly superior in patients with lower SUV-T of ≤16 than patients with higher SUV-T of >16 (90.8% vs. 58.2%, p = 0.005). Additionally, in the subgroup analysis for T3-4, GTV-T was a significant prognostic factor for LRFS (5-year LRFS: GTV-T ≤ 33 vs. > 33 mL, 100% vs. 83.5%, p = 0.022).
Discussion and Conclusion
The new 8th edition of the AJCC/UICC staging system for nasopharyngeal cancer has been proposed based on the data from contemporary patients who were staged with MRI and treated with IMRT. The 5 changes from 7th edition to 8th edition of the AJCC/UICC staging system were as followings [6]: (1) downstaging pterygoid muscle involvement from T4 to T2 criteria; (2) adding prevertebral muscle involvement as T2 criteria; (3) replacing N3b criteria from supraclavicular fossa to the extension below the caudal border of the cricoid cartilage; (4) merging N3b and N3a as N3; (5) merging IVA (T4N0-2) and IVB (N3) as IVA. For T category, prognostic significance of pterygoid muscle involvement without other T3/4 criteria has been a controversial issue, and categorized as T2 vs. T4 according to the 5th-6th vs. 7th edition of the AJCC/UICC staging system, respectively. In the 8th edition of the AJCC/UICC staging system, pterygoid muscle involvement without other T3/4 criteria were downstaged from T4 to T2 by the extensive literature review and validation for patients who were staged with MRI [6]. In present study, among 51 patients with T4 category, 22 patients had pterygoid muscle involvement. However, all of them also had other T4 criteria and no patient was downstaged to T2 or T3. The incidence of pterygoid muscle involvement without other T3/4 criteria was similarly low in the study of Pan et al. [6] which validated 8th edition of the AJCC/UICC staging system in 1,609 patients. In that study, among 740 patients with T4 category, 590 patients had pterygoid muscle involvement, and only 53 patients (9%) were without other T3/4 criteria and downstaged to T2. For N category and stage group, similarly to the results of Pan et al., changes from 7th edition to the 8th edition of the AJCC/UICC staging system eliminated unnecessary subcategories and improved simplification. In present study, only 2 patients (2%) were N3a category, and DMFS rate of N3a was not significantly different with other N categories. For stage group, OS rates of stage IVA and stage IVB were not significantly different.
The N category (HR = 5.869) and stage group (HR = 11.062) were the significant prognostic factors for DMFS and OS, respectively, in multivariate analysis. However, for LRFS rates, T category according to the 8th edition as well as the 7th edition of the AJCC/UICC staging system were not significant prognostic factor. Even in the study of Pan et al. which validated prognostic value of T category according to the 8th edition of the AJCC/UICC staging system, LRFS rates were not significantly different between T2 and T3 [6]. In many previous studies, which evaluated prognostic value of T category according to the 7th edition of the AJCC/UICC staging system in patients who staged with MRI and treated with IMRT, LRFS rates were not significantly different between T1 and T2 [9], between T2 and T3 [10], between T1, T2, and T3 [6,11-13], and between T3 and T4 [14]. As we think, T category might represent tumor extent as well as limited dose coverage for tumor due to the proximity to the organs at risk in the past. However, LRFS differences between T categories seems to be diminished by better dose coverage for tumor in aspects of conformity and homogeneity as well as better sparing for organs at risk in the IMRT era. In the dosimetric aspect, downstaging pterygoid muscle involvement without other T3/4 criteria from T4 to T2 in the 8th edition of the AJCC/UICC staging system seems to be appropriate because that is not very close to the critical organs such as brain, brainstem, cranial nerve, and eye. Therefore, to improve prognostication of the current anatomy based staging system and to identify patients who may benefit from more aggressive treatments, additional prognostic factors are needed, and we evaluated prognostic value of the volumetric and metabolic information of primary tumor. In present study, GTV-T (≤ 33 vs. > 33 mL) was a significant prognostic factor for LRFS in T3-4 subgroup, and SUV-T (≤ 16 vs. >16) was a significant prognostic factor in T2-4 subgroup and non-keratinizing carcinoma subgroup. Moreover, incorporation of GTV-T and SUV-T into stage group improved prognostication for OS.
The GTV-T has been easily available by automatic calculation function in the planning system for three-dimensional conformal radiotherapy (3D-CRT) and IMRT, and many studies evaluated its prognostic significance in patients with nasopharyngeal cancer [14-24]. In contrast to T category, GTV-T seems to be remained as a significant prognostic factor for patients who were treated with IMRT [14-20] as well as 3D-CRT [21-24]. However, optimal cutoff values which were suggested in each study were varied from 15 to 60 mL [14-24], and that might be one of the reasons why the incorporation of GTV-T into staging system was difficult. Further studies with large number of patients and standardized protocol for image acquisition and GTV-T definition seem to be needed to identify widely acceptable and practical cutoff value. Recently, 18F-FDG PET has been frequently used, and large number of studies evaluated prognostic value of the pretreatment 18F-FDG PET parameters which might reflect metabolic activity of tumor. The SUV-T has been the most widely used 18F-FDG PET parameter because that can be obtained easily by automatic calculation and be less affected by physician, and many studies evaluated prognostic value of SUV-T [25]. However, similarly to the GTV-T, optimal cutoff values were varied from 5 to 15.6 [25], and that might be the major obstacle incorporating SUV-T into staging system. Further studies with large number of patients and standardized protocol for imaging and interpretation of 18F-FDG PET are needed.
We evaluated the prognostic value of the 8th edition of the AJCC/UICC staging system of nasopharyngeal cancer in our institution with an intermediate-incidence for nasopharyngeal cancer, and included relatively large number of patients with long term follow-up. However, present study had several limitations. First, this was a single institutional, retrospective study, and selection bias might exist. Second, GTV-T and SUV-T were not available in all patients. We thought that might be the reason of that GTV-T and SUV-T were not significant prognostic factors in multivariate analysis. Third, we only evaluated prognostic value of volumetric and metabolic information for primary tumor, but not for regional lymph nodes. Further studies which include large number of patients and investigate whether volumetric and metabolic information for primary tumor as well as regional lymph nodes refine the prognostication of current anatomy based staging system in nasopharyngeal cancer are needed. Fourth, other biologic factors such as deoxyribonucleic acid copies of plasma Epstein-Barr virus that might have prognostic significance were not evaluated.
In conclusion, current anatomy based staging system has limitations on prognostication for nasopharyngeal cancer despite the most accurate assessment of tumor extent by MRI. Tumor volume/metabolic information seem to improve prognostication of current anatomy based staging system, and further studies are needed to confirm its clinical significance.
Notes
Conflict of Interest
No potential conflict of interest relevant to this article was reported.


