National trends in radiation dose escalation for glioblastoma
Article information

Abstract
Purpose
Glioblastoma (GBM) carries a high propensity for in-field failure despite trimodality management. Past studies have failed to show outcome improvements with dose-escalation. Herein, we examined trends and outcomes associated with dose-escalation for GBM.
Materials and Methods
The National Cancer Database was queried for GBM patients who underwent surgical resection and external-beam radiation with chemotherapy. Patients were excluded if doses were less than 59.4 Gy; dose-escalation referred to doses ≥66 Gy. Odds ratios identified predictors of dose-escalation. Univariable and multivariable Cox regressions determined potential predictors of overall survival (OS). Propensity-adjusted multivariable analysis better accounted for indication biases.
Results
Of 33,991 patients, 1,223 patients received dose-escalation. Median dose in the escalation group was 70 Gy (range, 66 to 89.4 Gy). The use of dose-escalation decreased from 8% in 2004 to 2% in 2014. Predictors of escalated dose were African American race, lower comorbidity score, treatment at community centers, decreased income, and more remote treatment year. Median OS was 16.2 months and 15.8 months for the standard and dose-escalated cohorts, respectively (p = 0.35). On multivariable analysis, age >60 years, higher comorbidity score, treatment at community centers, decreased education, lower income, government insurance, Caucasian race, male gender, and more remote year of treatment predicted for worse OS. On propensity-adjusted multivariable analysis, age >60 years, distance from center >12 miles, decreased education, government insurance, and male gender predicted for worse outcome.
Conclusion
Dose-escalated radiotherapy for GBM has decreased over time across the United States, in concordance with guidelines and the available evidence. Similarly, this large study did not discern survival improvements with dose-escalation.
Introduction
Glioblastoma (GBM) is the most common primary brain tumor in adults, occurring in up to 25,000 patients per year [1]. GBM is an extremely aggressive tumor, with 5-year survival rates bordering on 10%. The up-front treatment includes maximal safe resection followed by adjuvant radiation therapy with temozolomide [2]. Despite this aggressive multidisciplinary treatment, local failure remains the most significant issue [3-5]. To address the extremely high propensity for local failure, there have been several trials evaluating radiation dose escalation. Unfortunately, results of the vast majority of those studies did not show a discernible benefit [6-8]. With recent advances in radiation techniques, imaging, and systemic therapy, perhaps there is a role for revisiting dose escalation in GBM. Thus, the goal of this study was to review trends in dose escalation (as well as outcomes thereof) as part of the up-front treatment of GBM using the National Cancer Database (NCDB).
Methods and Materials
The methods for performing an analysis of the NCDB have been described previously [9,10]. We conducted a retrospective review using de-identified data from the NCDB, which is exempt from Institutional Review Board oversight. The NCDB is a tumor registry jointly maintained by the American Cancer Society and the American College of Surgeons for more than 1,500 hospitals accredited across the United States by the Commission on Cancer. The database is estimated to capture up to 70% of newly diagnosed malignancies each year across the country. We queried the NCDB from 2004–2014 for patients with GBM that had surgical resection and external beam radiation to the brain with chemotherapy. Patients had to have at least 2 months of follow-up and radiation doses of at least 59.4 Gy. We used 59.4 Gy as a cutoff to exclude any patients that may have been treated with more hypofractionated schedules due to age or poor performance status. We considered dose escalation any dose ≥66 Gy based on treatment criteria in Radiation Therapy Oncology Group (RTOG) 9803 which started escalation at 66 Gy [8]. A comprehensive overview of the patient selection criteria is presented in Fig. 1.
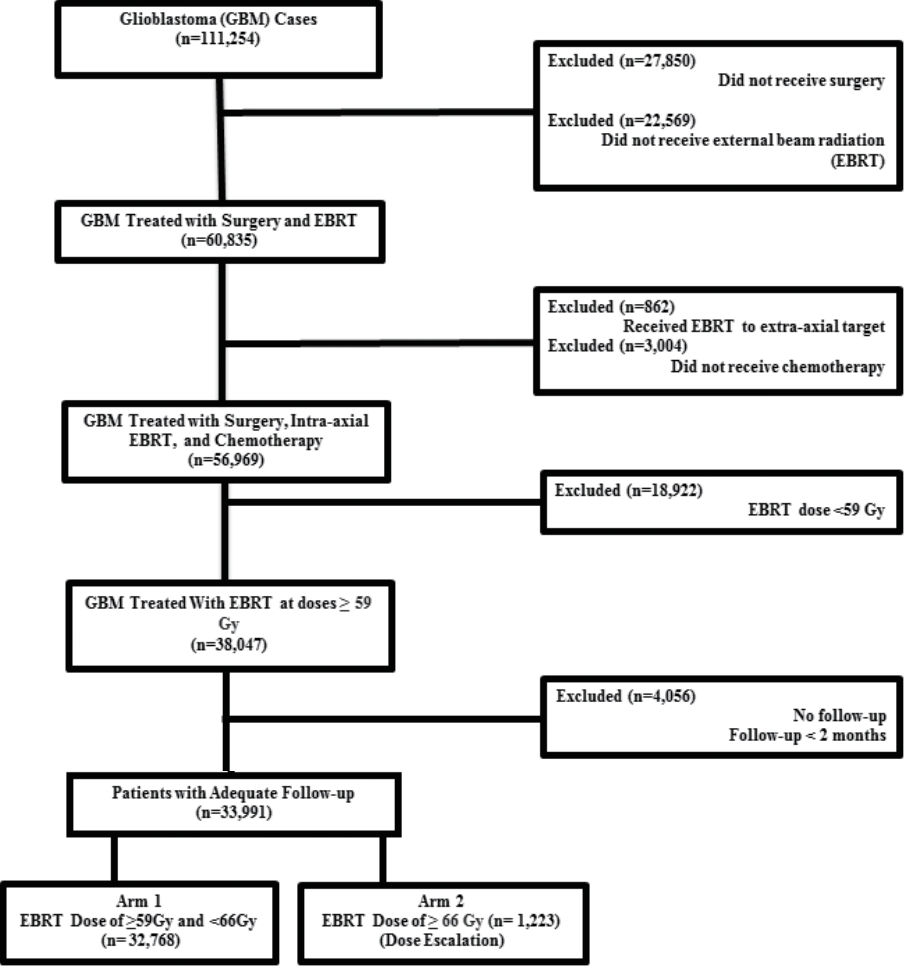
CONSORT diagram dose escalation versus conventional radiation dose in glioblastoma.
Race was broken down into three broad categories: Caucasian, African American, or other. Comorbidity was quantified using the Charlson/Deyo comorbidity index [11]. Socioeconomic data in the patients’ residence census tract were provided as quartiles of the percentage of persons with less than a high school education and median household income. The facility type was assigned according to the Commission on Cancer accreditation category. Locations were assigned based on data provided by the US Department of Agriculture Economic Research Service. Insurance status is documented in the NCDB as it appears on the admission page. The data used in the study are derived from a deidentified NCDB file. The American College of Surgeons and the Commission on Cancer have not verified and are not responsible for the analytic or statistical methodology employed, or the conclusions drawn from these data by the investigator.
Data were analyzed using MedCalc version 18 (MedCalc Software, Ostend, Belgium). Summary statistics are presented for discrete variables. Chi-square tests compared sociodemographic, treatment, and tumor characteristics between the treatment groups. Overall survival was calculated in months from time of diagnosis to date of last contact or death which is recorded in the NCDB. Kaplan-Meier curves were used to calculate cumulative probability of survival [12]. Log-rank statistics were used to test whether there was a statistically significant difference in the cumulative proportions across groups. A Cox proportional hazards model was used for multivariable survival analysis [13]. Due to the large nature of the dataset, factors significant on univariable Cox regression were entered using a stepwise backward elimination process. Adjusted hazard ratios and 95% confidence intervals are reported, using an α level of 0.05 to indicate statistical significance.
Propensity score-adjusted survival analysis was used to account for indication bias due to lack of randomization between patients receiving standard and escalation radiation dose [14]. Multivariable logistic regression was used to calculate a propensity score indicative of conditional probability of receiving standard or escalation radiation dose. The propensity model included observable variables associated with treatment selection on multivariable logistic regression. A Cox proportional hazards model was then constructed incorporating the propensity score, but also excluding factors included in the propensity score calculation to avoid overcorrection. The assumption of balance was further validated by stratifying the data into propensity score-based quintiles, and confirming that the difference in propensity score mean per quintile was less than 0.10.
Results
We identified 33,991 patients meeting the above eligibility criteria, with 1,223 patients receiving dose escalation. Table 1 displays patient characteristics of the population. Dose escalation decreased over time, from 8% in 2004 to approximately 2% in 2014 (Fig. 2). Predictors of escalated dose were African American race, lower comorbidity score, treatment at a community center, decreased income, and more remote year of treatment (Table 2). The median dose in the escalation group was 70 Gy (range, 66 to 89.4 Gy). The median dose in the standard arm was 60 Gy (range, 59.4 to 65.98 Gy). The median time to start of radiation was 32 days (interquartile range, 24 to 41 days) and 33 days (interquartile range, 26 to 42 days) for escalated and standard dose radiation, respectively. The median time to start of chemotherapy was 30 days (interquartile range, 21 to 42 days) and 32 days (interquartile range, 22 to 43 days) for escalated and standard dose radiation, respectively.

Patient demographics and clinical characteristics at baseline (n = 33,991)
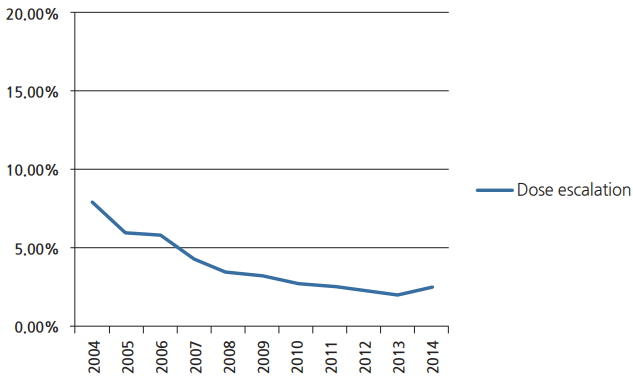
Line graph constructed via MedCalc demonstrating the declining utilization of dose escalation beyond 66 Gy in management of glioblastoma.

Comparative use of dose escalation by baseline characteristics in patients receiving brain radiation for glioblastoma
The median follow-up for the entire group was 15.6 months (range, 2 to 155 months). Median overall survival was 16 months, with a 5-year survival of 8.5%. On univariable analysis, median overall survival was 15.8 months with escalated doses, compared to 16.2 months with standard doses (p = 0.35) (Fig. 3). Five-year overall survival was identical, 8.5% in both groups. O-6-methylguanine-DNA methyltransferase (MGMT) status is tracked in the NCDB as of 2010. A total of 3,400 patients in our cohort (10%) had documented MGMT status on record. For patients that had MGMT methylation the median survival was 24 months in standard and dose escalated groups (p = 0.12). For patients that were MGMT-unmethylated, median overall survival was 16 months in both arms (p = 0.78).
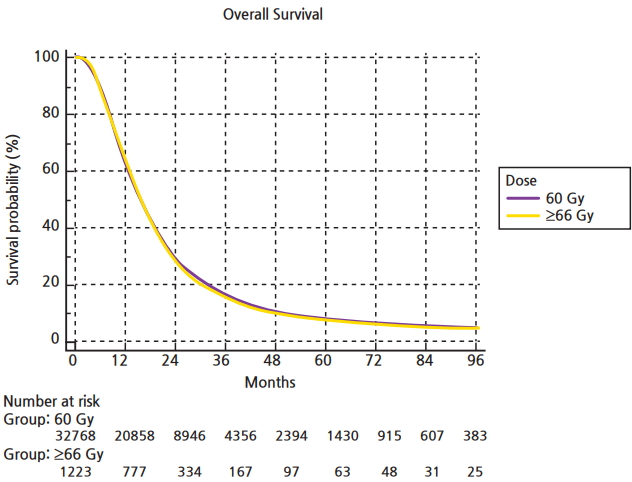
Kaplan-Meier curve constructed via MedCalc comparing overall survival in patients with glioblastoma receiving conventional radiation dose versus dose escalation beyond 66 Gy.
On multivariable analysis age >60 years, higher comorbidity score, treatment at community centers, lower education, lower income, government insurance, Caucasian race, male gender, and more remote year of treatment predicted for worse overall survival (Table 3). As described in the methods, a logistic regression was used to generate a propensity score and included comorbidity score, facility type, income, location, race, and year of treatment. Multivariable analysis with propensity score included was then run to determine predictors of outcome (excluding those factors used to generate propensity score). On propensity adjusted multivariable analysis age >60 years, distance from treatment center >12 miles, decreased education, government insurance, and male gender predicted for worse overall survival (Table 3).

Multivariable cox proportional hazards models for overall survival in patients receiving radiation for glioblastoma, without and with propensity score adjustment
Discussion and Conclusion
GBM remains the most common primary brain tumor in adults, with an aggressive course and disappointing 5-year survival rates despite advances in imaging, surgery, radiation, and systemic therapy [15.16]. The current standard of care for patients with good performance status is maximal safe resection, followed by concurrent chemoradiation and adjuvant chemotherapy [2]. Despite aggressive therapy of GBM, local failure remains the most pressing issue. Herein, we evaluated trends and outcomes with radiation dose escalation. This was decreasing in the United States over time, and was not independently associated with survival. These large-volume studies lend credence to national guidelines and prior studies that did not discern an appreciable benefit to dose escalation.
A study from UAB examined outcomes and patterns of failure in close to 100 GBM patients treated with smaller field sizes to 60 Gy [3,4]. In that patient population, 87% of failures were either in-field or marginal. A group from Italy likewise published patterns of failure after radiation to 60 Gy with Temodar in 105 patients [5]. In that series, failures were central, in-field, or marginal in 87% of cases. Interestingly, for patients that were unmethylated, 91% of failures were central or in field (compared to 60% for methylated tumors). These poor local control rates sparked the idea that perhaps increasing doses of radiation could lead to improved outcomes.
One of the first attempts at dose escalation was in RTOG 9305, a multi institutional study which randomized 203 patients to SRS followed by 60 Gy with BCNU or radiation to 60 Gy with BCNU [7]. Of note, the SRS ‘boost’ was prior to external beam radiation. With 5 years of follow-up, the survival in both arms was 13 months, with no difference in pattern of failure or quality of life. A more recent RTOG study, 0023, explored treating patients post operatively to 50 Gy with 4 weekly fractions of stereotactic radiotherapy of 5–7 Gy, for a cumulative dose of 70–78 Gy [17]. Patients also received BCNU for 6 cycles. Seventy-six patients were evaluable and median overall survival was 12.5 months, with no difference compared to historical controls. Other groups have experimented with altered (hypo)fractionation with concurrent chemo as a means of dose escalation. The group from Toledo treated 24 patients with 60 Gy in 10 fractions with temozolomide [18]. Of the 17 patients that experienced failure, only 50% of them were central, in-field, or marginal. The median overall survival was 33 months, certainly an improvement compared to past studies pre-dating the use of temozolomide. It is important to distinguish that in our analysis, we did not include patients treated with up-front SRS, as that sample size was only a small fraction of GBM patients in the NCDB. Regardless, SRS did play a historical role in dose escalation, and remains an important tool for re-irradiation in the salvage setting for GBM patients [19-21].
RTOG 9803 was a phase I study which utilized more conventional radiation techniques (i.e., 2 Gy daily fractions) with concurrent chemotherapy in the form of BCNU [8]. Following an initial 46 Gy, patients were treated to 66, 72, 78, or 84 Gy using three-dimensional conformal radiotherapy (3D CRT). As a phase I study, there were no dose limiting toxicities at any level. The median survival was greatest in the 84 Gy group (14–19 months depending on tumor volume) and lowest in the 66 Gy arm. The authors concluded that dose escalation was feasible, safe, and would perhaps have a larger role with advancing technology, imaging, and systemic therapy. A more recent study from Washington University in St. Louis compared outcomes in patients <70 years of age that received either 60 Gy or >60 Gy with concurrent temozolomide [6]. Over 200 patients were included in the analysis. Predictors of overall survival were age, performance status, and extent of resection. At 5 years there was no difference in overall survival between standard 60 Gy or higher doses (12%–13%), with the authors concluding that dose escalation with temozolomide did not improve outcomes.
The results of this NCDB analysis confirm a decrease in the use of dose escalated radiation for the up-front treatment of GBM. In 2004, it was a minority of patients being treated in such a manner (8%), further shrinking to only 2% by 2014. These trends in practice patterns certainly align with the results of the studies discussed above. Further supporting that trend, our analysis did not show any difference in survival between patients being treated to conventional doses compared to doses >66 Gy. Not surprisingly, our analysis also showed worse outcomes with clinical factors such as increasing age, higher comorbidity score, and decreased income; all of which are surrogates for poorer general health. More remote treatment year was also associated with poorer outcome, likely due to emerging systemic therapies and increased salvage therapy options with the passage of time.
Optimal therapy of high-grade (as well as low-grade) gliomas is increasingly moving towards molecular-based management [22]. As such, a main theme of completed studies has been to more aggressively treat those patients with a better ‘molecular prognosis’, because those with poor molecular features benefit to a lesser degree from more aggressive interventions. For instance, although all patients herein received chemotherapy, the magnitude of benefit from temozolomide for GBMs is much larger for MGMT-methylated tumors than unmethylated cases; moreover, more aggressive chemotherapy has outcome benefits based on interim results of the NOA-09 phase III trial [23]. Similarly, a major unresolved question in GBM dose-escalation is whether ‘molecularly favorable’ GBMs benefit from dose escalation. This is a substantially important issue because virtually all historical dose-escalation trials did not account for MGMT or IDH1 mutational status. The fact that patterns of failure in MGMT-methylated disease are different (less in-field failures) implies that there may be a greater degree of dose-response in MGMT methylated disease, and accordingly, dose-escalation may benefit these patients to a greater degree. Although our study did not show a statistical benefit in overall survival to dose-escalation for MGMT-methylated tumors, it was highly limited by the fact that (1) this parameter was not recorded in the NCDB prior to 2010, and (2) IDH1 information is virtually unreported in the NCDB. However, the only known study addressing this issue did observe a progression-free and overall survival benefit with dose-escalated radiotherapy for MGMT-unmethylated patients [24]. To that end, there could be some role for re-exploration of dose escalation in MGMT-unmethylated patients.
The limitations of this study are those intrinsic to the NCDB, including the retrospective nature of collection and analysis which inevitably results in a selection bias. Furthermore, the NCDB lacks important data on outcomes such as toxicity, local failure, chemotherapeutic agent(s), and number of treatment cycles completed, all of which play an important role in determining outcome for GBM in a standard and dose escalated setting. Moreover, salvage therapy is also not recorded in the NCDB, which is an important player in long term outcomes for GBM patients given the high likelihood of failure. Also, we did not examine radiation technique in this particular analysis and its potential interaction with outcome and dose escalation, as it can be recorded in the NCDB either by modality (intensity-modulated radiation therapy vs. 3D CRT) or photon energy, thus leading to some confusion and perhaps misrepresentation.
In conclusion, this NCDB analysis confirms decrease in the use of dose escalation over time for GBM in concordance with the results of multiple trials. As expected, we did not observe any benefit in outcomes with dose escalation. There is potentially room for re-exploration of dose escalation in a clinical trial setting in the modern era with advances seen in imaging, radiation, and systemic therapy.
Notes
Conflict of Interest
No potential conflict of interest relevant to this article was reported.