Interfraction variation and dosimetric changes during image-guided radiation therapy in prostate cancer patients
Article information

Abstract
Purpose
The aim of this study was to identify volume changes and dose variations of rectum and bladder during radiation therapy in prostate cancer (PC) patients.
Materials and Methods
We analyzed 20 patients with PC treated with helical tomotherapy. Daily image guidance was performed. We re-contoured the entire bladder and rectum including its contents as well as the organ walls on megavoltage computed tomography once a week. Dose variations were analyzed by means of Dmedian, Dmean, Dmax, V10 to V75, as well as the organs at risk (OAR) volume. Further, we investigated the correlation between volume changes and changes in Dmean of OAR.
Results
During treatment, the rectal volume ranged from 62% to 223% of its initial volume, the bladder volume from 22% to 375%. The average Dmean ranged from 87% to 118% for the rectum and 58% to 160% for the bladder. The Pearson correlation coefficients between volume changes and corresponding changes in Dmean were -0.82 for the bladder and 0.52 for the rectum. The comparison of the dose wall histogram (DWH) and the dose volume histogram (DVH) showed that the DVH underestimates the percentage of the rectal and bladder volume exposed to the high dose region.
Conclusion
Relevant variations in the volume of OAR and corresponding dose variations can be observed. For the bladder, an increase in the volume generally leads to lower doses; for the rectum, the correlation is weaker. Having demonstrated remarkable differences in the dose distribution of the DWH and the DVH, the use of DWHs should be considered.
Introduction
Significant interfraction changes of the rectal and bladder volume during prostate cancer (PC) irradiation have been reported [1-3]. Furthermore, changes in localization and organ shape of the bladder and rectum have been observed [4]. In the past, interfraction and intrafraction motion of the prostate and the prostatic bed was subject of several investigations [5-7]. All these factors may lead to an underdosage of the planning target volume (PTV) and to serious side effects of irradiation. The introduction of modern irradiation techniques like intensity-modulated radiotherapy (IMRT) and image-guided radiotherapy (IGRT) was a valuable approach handling these problems: IMRT allows a highly conformal irradiation of target volumes. IGRT decreases localization errors and improves the accuracy of irradiation. Hence, it enables the use of smaller PTV margins. Nevertheless, irradiation of the prostate or the prostatic bed is still accompanied by side effects limiting the quality of life [8-10].
The aim of this study was to identify volume changes of organs at risk (OARs) during RT. Corresponding dose variations were also evaluated. Changes in both volume and dose were investigated for the entire rectum and bladder including its contents as well as for the bladder and rectal wall.
Materials and Methods
1. Patients
We retrospectively analyzed 20 patients with PC treated with helical tomotherapy. Ten patients received irradiation of the prostate bed, 9 of which with a total dose of 68 Gy in 34 fractions and one with 64 Gy in 32 fractions (group A). The other 10 patients received a primary RT of the prostate, 9 with a total dose of 76.5 Gy in 34 fractions and one with a total dose of 74 Gy in 37 fractions (group B).
2. Radiation planning
Patients received a kilovoltage computed tomography (kVCT) with 130 kV for treatment planning with an axial slice thickness of 3 mm (Siemens SOMATOM; Siemens Inc., Erlangen, Germany). This CT was exported to the planning software (Eclipse Treatment Planning System; Varian Medical Systems, Palo Alto, CA, USA) and target volumes and OARs were delineated by an experienced radiation oncologist. The original treatment plan was calculated with the TomoTherapy Treatment Planning System ‘Planning Station’ version 4 by Tomotherapy (Accuray Inc., Sunnyvale, CA, USA). Following dose constraints for OAR were used in the planning process: For the bladder V40 <40%, for the rectum V40 <40% and maximum dose (Dmax) ≤75 Gy, The gross tumor volume (GTV) was defined as the prostate with adjacent soft tissue and base of seminal vesicles, the clinical target volume (CTV) as the GTV and the PTV as the CTV + 7 mm, planning CT acquisition and RT treatment was carried out with full bladder and empty rectum. Therefore patients were told to drink about half a liter one hour beforehand.
3. Re-contouring and dose recalculations
Before each treatment fraction, a megavoltage computed tomography (MVCT) with 3.5 MeV was acquired for image guidance. Once a week the scan length of the MVCT was increased in order to include the whole bladder and rectum. These MVCTs were exported to Eclipse Treatment Planning System and OARs were delineated for each patient. The whole rectum was delineated from the anus with a mean length of 9.4 cm (range, 6.9 to 10.8 cm) for group A and 10.5 cm (range, 8.1 to 12.0 cm) for group B in the craniocaudal axis. Due to the anatomy of bladder and rectum as hollow organs, the use of dose volume histograms (DVH) for describing the dose-volume distribution, or for predicting side effects of irradiation, does not appear appropriate. A more rational approach is the delineation of the organ walls and the use of dose wall histograms (DWH) for hollow organs, as proposed by several research groups [11,12]. We auto-generated an inner bladder and an inner rectal wall to the delineated outer walls with a distance of 4 mm assuming a wall thickness of 4 mm similar to Tucker et al. [12].
We calculated the dose of the day on the corresponding MVCT. Afterwards we multiplied the dose of the day with the number of fractions received in order to compare the calculated dose with the originally planned dose.
4. Volume and dose evaluation
Dose variations were analyzed by means of the median dose (Dmedian), mean dose (Dmean), Dmax, V10, V20, V30, V40, V60, V70, V75, and the OAR volume. In order to evaluate interfraction changes of volume and Dmean of OARs, volumes, and doses of the planning-CT were normalized to equal 100% and the corresponding data on the MVCTs were analyzed in relation to these values.
The Pearson correlation coefficient was calculated to investigate the correlation between volume changes and changes in Dmean of bladder and rectum. The significant level was set at p < 0.05.
For analyzing the impact of endorectal balloon (ERB) patients were divided into two groups. ERB was used in patients #12–20 of group B (ERBG; n = 9). In all patients of group A and in patient #11 of group B ERB was not used (nonERBG; n = 11). Differences in the average standard deviations of ERBG and non-ERBG were statistically analyzed using the Mann-Whitney U-test with a significance level of 0.05.
Differences in the dose statistic of the DVH and the DWH were tested for statistical significance using the Wilcoxon signed-rank test with a significance level of 0.05.
Results
1. Volume and dose evaluation
During treatment, the rectal volume ranged from 62% to 223% (group A, 64%–223%; group B, 62%–157%) of its initial volume, the bladder volume from 22% to 375% (group A, 22%–375%; group B, 30%–311%). Means of the rectal/bladder volume during treatment and associated Dmeans and standard deviations are displayed in Table 1.
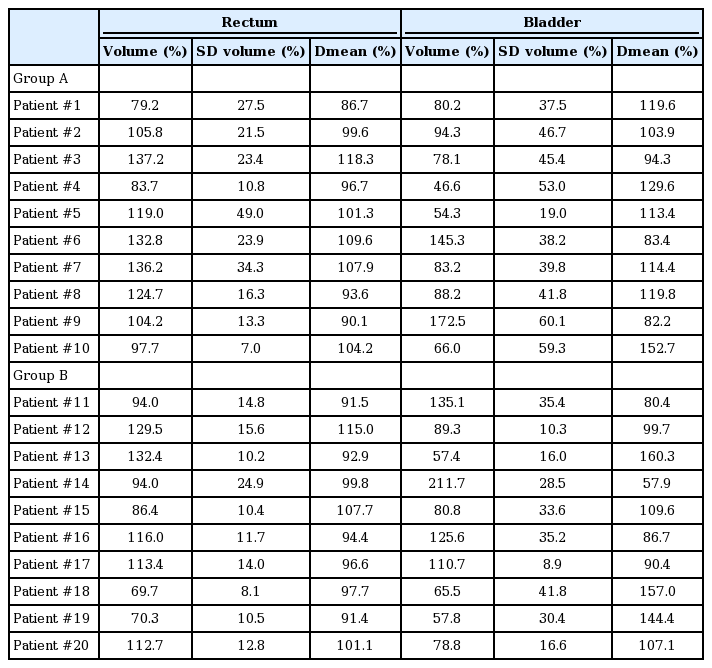
Means of the rectal/bladder volume during treatment and associated Dmeans and SDs for all 20 patients
Mean rectal volume changes and standard deviations of all 20 patients are illustrated in Fig. 1. The average standard deviations in ERBG were significant smaller than in non-ERBG (p = 0.048).
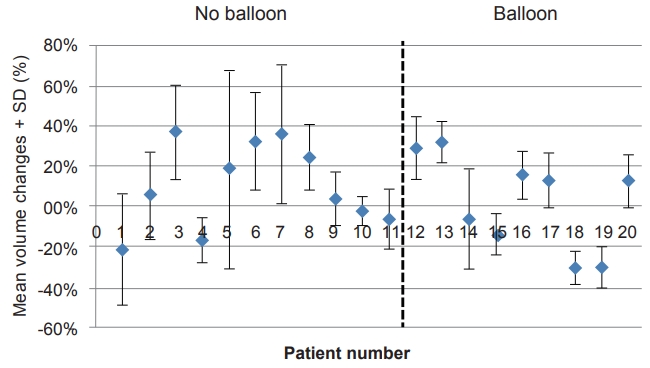
Mean rectal volume changes and standard deviations of all 20 patients.
Fig. 2A and 2B illustrate exemplarily the development of the Dmean of bladder and rectum of group A. Both change irregularly during irradiation. Fig. 3A and 3B display bladder and rectal contours of the planning CT and MVCTs.
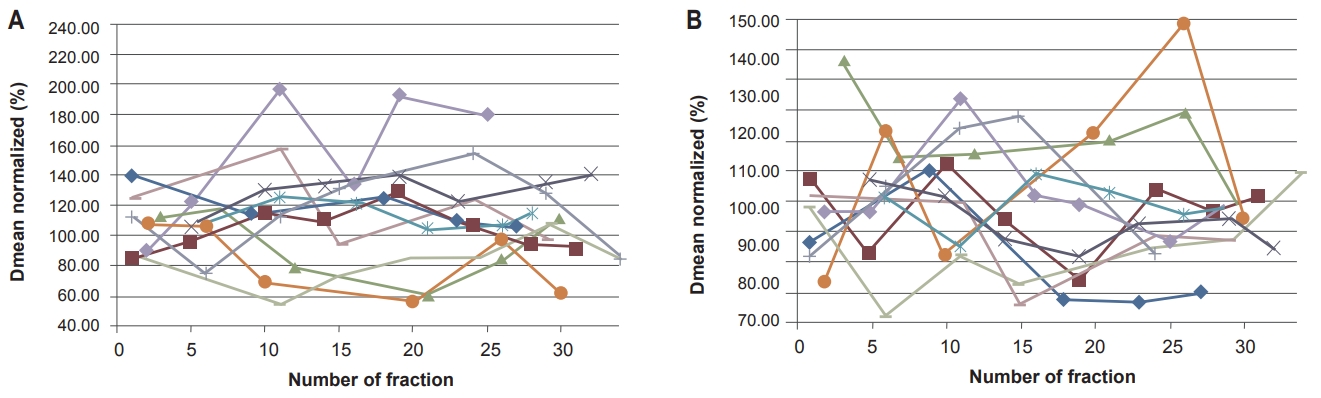
Development of the bladder Dmean (A) and the rectal Dmean (B) during treatment (group A).

(A) Bladder contours and DVH of the planning CT (blue) and of the MVCTs (yellow) displayed on the planning CT (patient #2). (B) Rectal contours and DVH of the planning CT (blue) and of the MVCTs (yellow) displayed on the planning CT (patient #7). DVH, dose volume histogram; CT, computed tomography; MVCT, megavoltage computed tomography.
Fig. 4 shows the regression analysis between the average Dmean and the average volume for the bladder of all 20 patients. As expected, smaller volumes correspond with higher Dmeans of the bladder in both groups A and B (r = -0.82; p = 9.1e-06). For the rectum, a correlation between volume and Dmean was found (r = 0.52; p = 0.02).

Regression line of the bladder of all 20 patients.
2. Comparison of the DVH with the DWH
With regard to the planning CT the comparison of the rectal/ bladder wall (DWH) with the rectum/bladder as entire organs including its contents (DVH) presents us with the following data. The average Dmean of the DWH is 3.2%—group A, 3.3% (range, -1.2% to 17.2%); group B, 3.1% (range, -0.8% to 5.7%—higher than of the DVH for the rectum; for the bladder, it is 9.4%—group A, 11.4% (range, 0.0% to 27.1%); group B, 7.4% (range, -3.4% to 20.7%)—higher. Observed differences in Dmean are statistically significant (rectum p = 0.001; bladder p = 0.0005).
Considering interfraction changes of the differences of the Dmean (DWH vs. DVH) we could not identify a time trend during radiation therapy neither in group A nor in group B.
Looking at the dose statistics it can be seen that V10, V20, and V30 of the rectum are slightly lower for the DWH than for the DVH for most patients in both groups, whereas V40 to V75 of the rectum are higher for the DWH than for the DVH. For the bladder, the DWH is smaller for V10 for the majority of patients in both groups, and also for V20 in group B. The other parameters, V20 in group A and V30 to V75 in A and B, are higher in the DWH. Fig. 5 displays, as an example, the DVH (blue) and the DWH (yellow) of the rectum/rectal wall of patient #12. In summary, the DWH shows higher values than the DVH in the high does region for the bladder and for rectum in both groups. In addition the Dmean of the DWH is higher than of the DVH for the bladder and the rectum for the majority of patients.
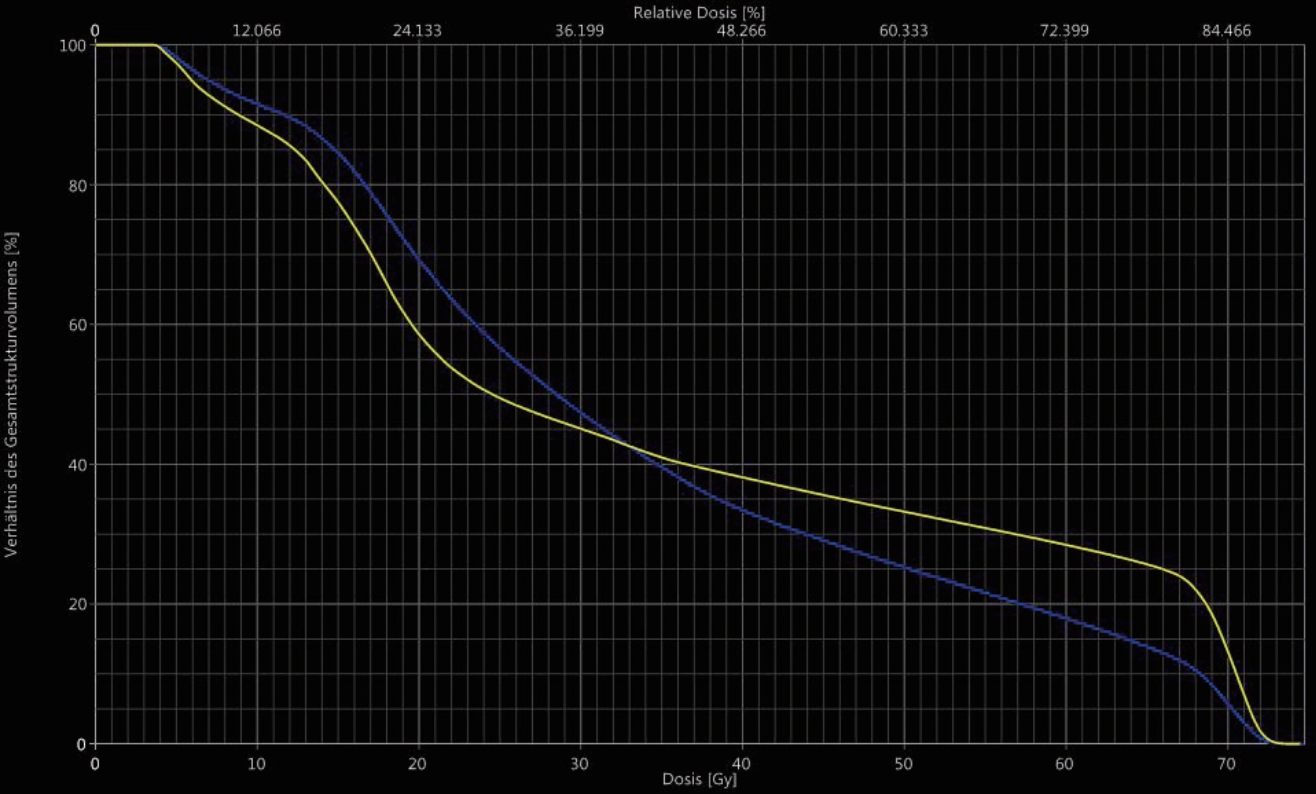
Dose volume histogram (DVH) and dose wall histogram (DWH) of the planning computed tomography of patient #12. The rectum including its contents (DVH) is displayed in blue, the rectal wall (DWH) in yellow.
Discussion and Conclusion
This study investigated volumetric and dosimetric interfraction changes of bladder and rectum during the course of RT of PC. Differences in the dose-volume distribution considering the DVH or the DWH were demonstrated. Further, the frequency and severity of acute side effects were analyzed.
Prior to our investigations, significant variations of bladder and rectal volumes during treatment were reported. Huang et al. [13] investigated a total of 112 treatment data sets of 28 patients with prostate cancer. They observed mean differences (±standard deviation) in the volume of 44% (±41%) for the bladder and 36% (±29%) for the rectum.
Chen et al. [14] included a total of 314 cone beam CTs of 19 patients. They presented remarkable interfraction volume changes with standard deviations of 13%–58% for bladder and 12%–50% for rectum, respectively.
We were able to show a statistically significant difference in the average standard deviation of the rectal volume between ERBG (13%) and non-ERBG (22%). Hence, the use of ERB appears to be related with a gain of stability of the rectal volume. This hypothesis is supported by Jameson et al. [15] and by de Leon et al. [16]. They both reported of an improved concordance index of rectal CBCT treatment volumes compared with rectal planning volumes in the ERB group than in the non-ERB group.
However, the rectal volume changes in the ERB group in our study are smaller than the changes reported by Huang et al. [13] and by Chen et al. [14], but neither Huang et al. [13] nor Chen et al. [14] did report whether their patients did use ERB.
Some patients (patients #4 and #5 of group A; patients #3 and #9 of group B) had smaller bladder volumes throughout the whole treatment compared to the initial bladder volume on the planning CT. Patients were instructed on the importance of a full bladder before and during treatment by their radiation oncologist. However, some patients could not reproduce bladder filling. The regression analysis between the Dmean and the volume of the bladder (r = -0.82) illustrated that lower bladder volumes correlate with higher radiation doses. Hence, if a patient is not able to reproduce bladder fillings comparable to the original treatment plan, the acquisition of a new kVCT with lower bladder volume and the generation of a new treatment plan should be taken into consideration.
For the rectum as well as the bladder, we monitored relevant dosimetric interfraction changes, as reported prior to our investigation [1,2,13]. As described above, lower bladder volumes are correlated with higher Dmeans of the bladder. This is mainly due to the higher percentage of the bladder located in the immediate vicinity of the prostate gland or the prostate bed caused by low bladder fillings. A full bladder expands in the cranial direction. Hence, the apex or even a greater part of the bladder is located outside of the irradiated field. The correlation between the rectal volume and the Dmean of the rectum (r = 0.52) was not as strong as observed for the bladder. Variations in the rectal volume were mainly caused by changes in the quantity of feces and by rectal air. Whether volume changes induce significant changes in rectal DVH depends on the direction and the height of the rectal distension. Rectal distension on the height of the CTV and to the ventral direction mostly influences the DVH. Another factor changing the dose delivered to the rectum is the rectal movement. Scaife et al. [17] investigated the anterior-posterior shift of the furthest anterior point of the rectum on the MVCTs with reference to the same point on the kVCT. They demonstrated large movements of this point in the course of treatment [17]. A significant change in position of the further rectal wall to the anterior may reduce the distance between the rectal wall and the CTV and cause higher doses to the rectum.
Former investigations addressed the dose-volume effect of OAR taking into account the anatomy of the bladder and rectum as hollow organs [11,12,18-20]. Maggio et al. [18] compared the dose statistics of a manually contoured bladder wall (DWH) with automatically generated bladder walls with 5, 7, and 10 mm thickness (DWH5, DWH7, DWH10) and with the whole bladder including filling (DVH). They demonstrated a high correlation of the DWH with the DWH5, DWH7, and DWH10. The correlation between the DWH and the DVH was lower. In our study, significant differences comparing the DWH with the DVH could be observed for the bladder as well as for the rectum. In summary, the average DVH shows higher values for the low-dose region V10 and partly for V20 and V30. For the mid-dose and high-dose region, V40 to V75, the DVH underrates the exposure of the bladder and the rectum in comparison to the DWH. The demonstrated differences and the differently strong correlation between the DWH and the DVH are responsible for uncertainties in predicting side effects based on the DVH. Therefore, the implementation of the DWH in clinical routine should be considered.
One limitation of this study is the small number of patients eading to a limited statistical power. Consequently, we are not able to give a definitive conclusion.
Another limitation is the reduced image quality of pretreatment MVCT which may lead to inaccuracy in OAR delineation. On the other hand interfraction volumetric and dosimetric changes observed are so big that our results are still significant.
Adaptive re-planning approaches have the potential to face indicated challenges. As to which concept, e.g., ‘plan of the day’ or fast online recalculation, will be the suitable solution for the routine patient treatment needs to be assessed in further evaluations.
In conclusion, for patients with PC, relevant variations in the volume of OAR, such as the rectum and bladder, can be observed. Hence, corresponding dose variations occur. No trend could be identified neither for the volumes nor for the doses. However, for the bladder, an increase in volume generally leads to lower doses. Regarding the rectum, the correlation between the volume and the dose change is weaker. Furthermore, we demonstrated remarkable differences in the dose distribution when considering either the organ walls or entire organs including filling. To better understand dose-volume effects and to be able to predict and to prevent side effects of RT, the use of DWHs should be considered.
Notes
Conflict of Interest
No potential conflict of interest relevant to this article was reported.