New methods for optical distance indicator and gantry angle quality control tests in medical linear accelerators: image processing by using a 3D phantom
Article information
Abstract
Purpose
In order to keep the acceptable level of the radiation oncology linear accelerators, it is necessary to apply a reliable quality assurance (QA) program.
Materials and Methods
The QA protocols, published by authoritative organizations, such as the American Association of Physicists in Medicine (AAPM), determine the quality control (QC) tests which should be performed on the medical linear accelerators and the threshold levels for each test. The purpose of this study is to increase the accuracy and precision of the selected QC tests in order to increase the quality of treatment and also increase the speed of the tests to convince the crowded centers to start a reliable QA program. A new method has been developed for two of the QC tests; optical distance indicator (ODI) QC test as a daily test and gantry angle QC test as a monthly test. This method uses an image processing approach utilizing the snapshots taken by the CCD camera to measure the source to surface distance (SSD) and gantry angle.
Results
The new method of ODI QC test has an accuracy of 99.95% with a standard deviation of 0.061 cm and the new method for gantry angle QC has a precision of 0.43°. The automated proposed method which is used for both ODI and gantry angle QC tests, contains highly accurate and precise results which are objective and the human-caused errors have no effect on the results.
Conclusion
The results show that they are in the acceptable range for both of the QC tests, according to AAPM task group 142.
Introduction
Quality control (QC) tests, recommended by institutions, such as the American Association of Physicists in Medicine (AAPM), are one of the important parts of the radiation oncology department's overall quality assurance (QA) program [1]. It is fundamentally important that the prescribed dose delivers accurately and precisely to the target volume. Geometric and mechanical accuracy of the medical linear accelerators (LINACs) should be tested and verified on a regular basis [2].
The source to surface distance (SSD) QC test of a LINAC is measured by using an optical device for measuring the SSD called optical distance indicator (ODI) which needs to have a daily QC test [3,4]. ODI is a device which shows the SSD on the surface using an optical graded ruler. In other words, ODI shows the current SSD by projecting the number on the couch.
Currently a mechanical distance indicator is used to verify the ODI [5]. Welsh et al. [2] used a tape measure with a digital screen to show the SSD for the ODI verification. Geyer [6] used a laser based tool to overcome the subjective human errors caused due to measuring the SSD by means of manual methods.
Usually spirit levels are used to perform the gantry angle QC test in the radiation oncology centers [7]. Welsh et al. [2] used a digital goniometer to find out the gantry angle. In order to improve the accuracy and precision of ODI QC test, as one of the important daily quality assurance tests, a new method has been developed which uses image processing.
The proposed method is also able to carry out the monthly gantry angle QC test as one of the other important mechanical QC tests without the need of any extra hardware.
The system is composed of a low-cost CCD camera, a simple phantom and software. The in-house software uses a distance measurement and angle detection method based on the number of pixel variation of images by referencing to four selected points in the image [8].
This method offers a quick setup and automatic measurement of the SSD and gantry angle. Since the values are automatically and directly saved into the database, any human-caused errors while reading the results could be eliminated. In the software, the real values are compared to the target values, and if the difference is acceptable by AAPM task group 142, the tests would be announced as it is passed.
The AAPM task group 40 and task group 142 recommend that up to 2 mm deviation between the real SSD and measured SSD and up to 1° between the real gantry angle and the measured angle are acceptable [3,4]
The purpose of this paper is to improve the accuracy and precision of ODI and gantry angle quality control tests by eliminating the error causes in other methods. In order to achieve this goal, the proposed method has been tested in two radiotherapy centers in Mashhad, Imam Reza (AS) Hospital and Reza (AS) Radiation Oncology Center.
Materials and Methods
1. System development
In order to measure the SSD and the gantry angle, our system includes a CCD camera, a 3D phantom and software. The SSD and gantry angle were calculated by using a pixel variation based algorithm. This system was established and tested on two Linacs in two radiation oncology centers in Mashhad, a Siemens Primus in Reza (AS) radiation oncology center and an ELEKTA Precise in Imam Reza (AS) hospital of Mashhad.
1) CCD camera
A 2-megapixel CCD camera was used to take photos from different distances of the surface and different angles around the zero angle. A CCD camera was used because of the better fill factor, uniformity and system noise compared to CMOS cameras [9]. The detailed information and photo of the camera could be found in Table 1 and Fig. 1, respectively.
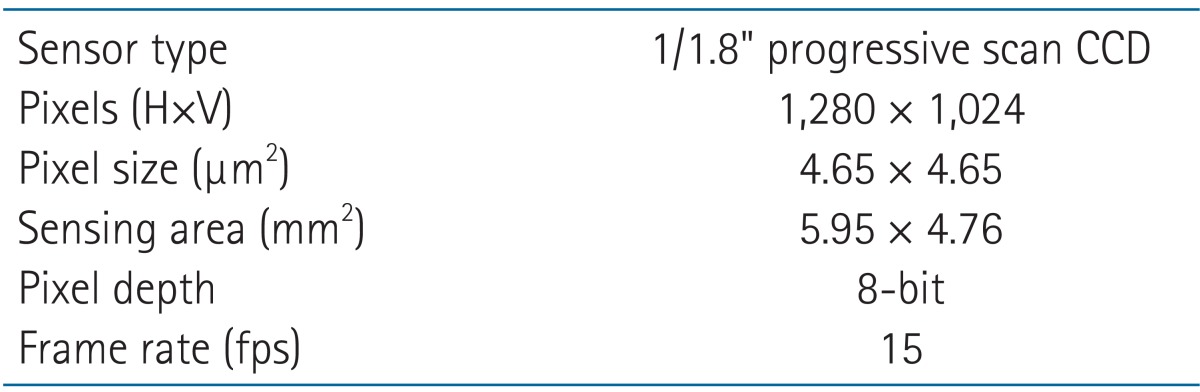
Detailed information of the CCD camera
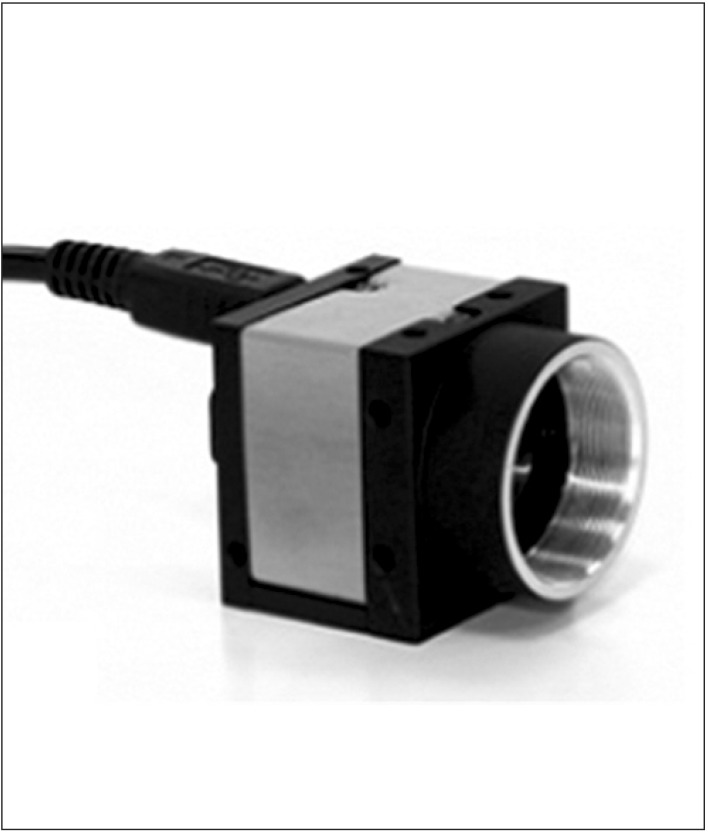
CCD camera used for the proposed method.
2) 3D phantom
The 3D phantom was made of six acrylic sheets (180 × 180 × 0.5 mm3) which create a cubic phantom together as illustrated in Fig. 2. Four circular fiducial marks, each of them with a diameter of 10 mm, has been engraved on the corners of an imaginary square with 150 mm sides on the surface of the 3D phantom. The image processing algorithm used these fiducial marks, as its references, to calculate the distance and angle.
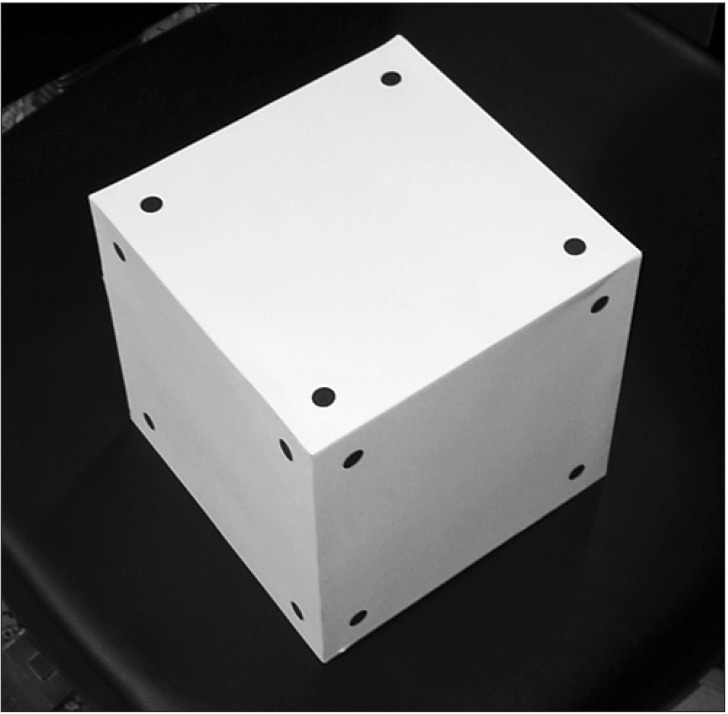
3D phantom used to perform the quality control tests.
3) Distance calculation algorithm
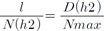
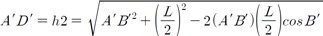
Hsu et al. [8] introduced a distance measurement algorithm based on pixel variations of images which was used for detecting source to surface distance in this study. Fig. 3 shows a schematic outline of the CCD camera capturing images at h1 and h2 heights between the lens and the surface in which hs shows the gap between the CCD sensor and the lens, D(h1) and D(h2) are the maximum horizontal length in centimetres available in the photos at each height, formed by the field of view of the camera at photographing distances h1 and h2 respectively, l is the distance between two adjacent reference points and N(h1) and N(h2) are the pixel counts of l at the two photographing distances. According to the triangles similarity theorem, Eqs. (1)-(4) are extracted:

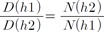
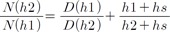
Schematic outline of the CCD camera capturing images at h1 and h2 heights between the lens and the surface.
Therefore, by having the height in one distance (h1) which is 100 cm by default, any other heights (h2) could be calculated by using Eq. (4).
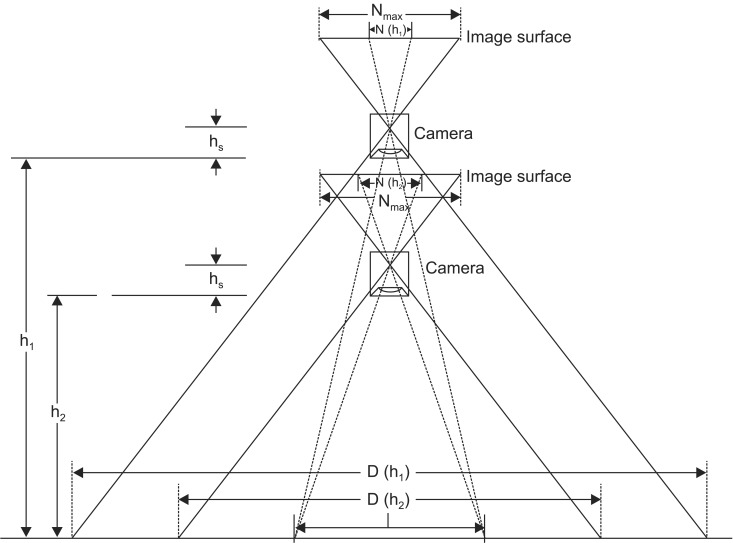
BC in Fig. 4 shows the side view of the top side of the 3D phantom in h1 which is the standard height. A and H indicate the lens and the CCD sensor of the camera, respectively, and X represents the X-ray source. Since the gantry angle is 0°, ABC is an isosceles triangle.
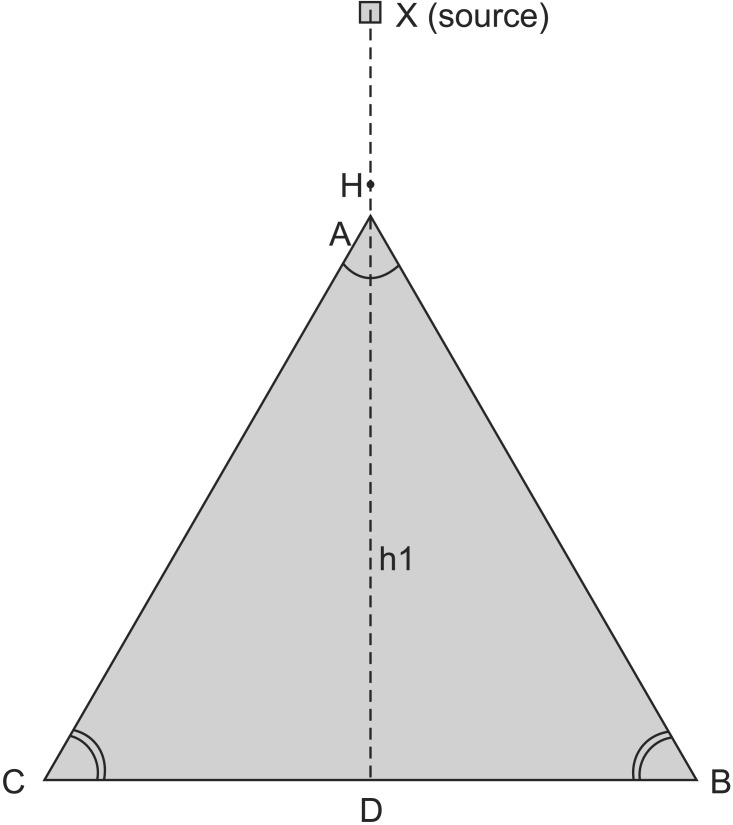
Side view of the gantry, camera and the phantom at standard SSD = 100 cm. SSD, source to surface distance.
In an unknown height as demonstrated in Fig. 5, h2 could be calculated in A'B'C' after figuring out A'B' and A'C' according to the Eqs. (5)-(9):
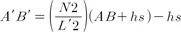
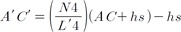

Side view of the gantry, camera and the phantom at an unknown source to surface distance.
And finally the SSD which is composed of h2 and the offset of the source to camera lens (XA or XA') distance could be calculated.
4) Angle detection algorithm
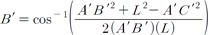
The gantry angle could be calculated at SSD = 100 cm in a wide range of about ±150°. In Fig. 6, A is the camera lens at 0°, while A' is the camera lens at an unknown angle. The unknown angle of the gantry is C2. A is calculated using the triangles theorem for ABC and since ABC is an isosceles triangle, C could also be figured out as shown in Eq. (11)-(13).
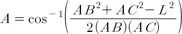

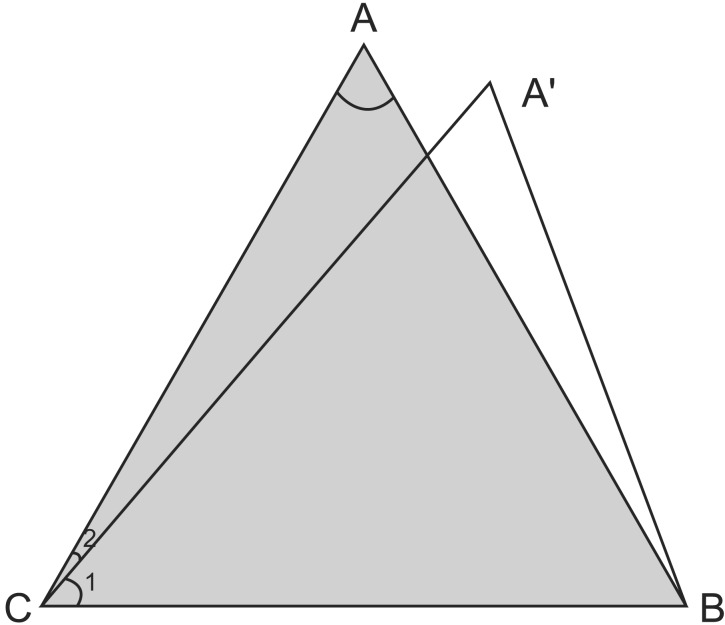
Side view of the camera lens and the phantom in 0° and an unknown degree for the gantry angle.
Since A'C and A'B distances are calculated by using the previous section algorithm, C1 is also calculated by means of triangle theorem, so having C and C1, both available, the gantry angle (C2) is figured out by using Eq. (14) and (15):
5) Computer software
The SSD and gantry angle calculating source codes are written in MATLAB 7.12. The steps which the software takes for SSD and gantry angle detection from the camera detection and snapshot to the reference points extraction and SSD and gantry angle calculation are mentioned in Fig. 7.

Steps which the software takes to calculate source to surface distance and gantry angle.
2. System performance
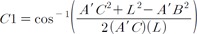
The first step to start the QC tests is to place the camera board in the accessory tray of the gantry and connect the cable to the laptop. The in-house software, developed for this system, should be started after placing the 3D phantom on the couch. Fig. 8 indicates the CCD camera and the 3D phantom while performing the QC tests.
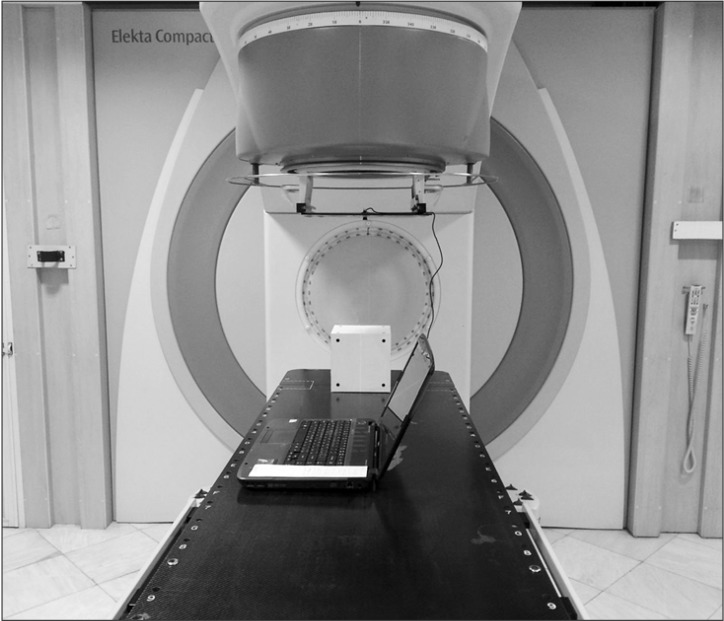
Quality assurance system setup with the camera on the gantry and the 3D phantom on the couch.
The position of the CCD camera should always be calibrated and fixed towards the 3D phantom. As it is not easy to have the CCD camera in the same position every time, we have added a software position alignment and calibration. As it is illustrated in Fig. 9, there is a cross on the screen, dividing it into four sections. These sections help to locate the phantom approximately in the middle of the screen. In order to adjust the location of the phantom exactly in the middle, some arrows would appear on the screen, guiding the user to move the phantom towards X and Y directions. In other words, there are four arrows showing up, down, right, and left. If there is any misalignment, a number would appear in front of one or more arrows, indicating the millimetres that the phantom should be moved in that direction.
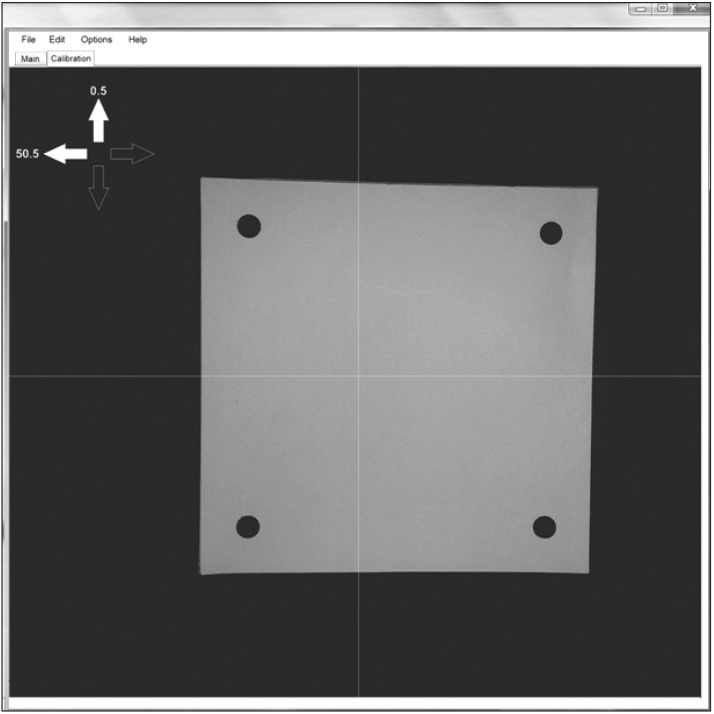
Camera calibration tab in the software. The millimetre numbers in front of the arrows demonstrate the shifts needed in the direction of the arrow.
The system is not so sensitive to the environment light and it could work if there are some lights on in the room, but since the best result is acquired when the environment has a higher brightness, it is strongly recommended to keep all the lights turned on.
After adjusting the phantom in the correct place, 'SSD QC' button on the main tab of the software would perform the SSD QC test automatically and would show the result while the 'gantry angle QC' button would execute the gantry angle QC test and display the conclusion.
In order to evaluate the accuracy and precision of the proposed method, the ODI QC test was performed at 95, 105, 110, and 115 cm for the SSD and the gantry angle QC test was carried out at 0°, 2°, 5°, 80°, 90°, and 150°.
Results
1. ODI QC test
The ODI QC test has been performed on an ELEKTA Precise and a SIEMENS Primus LINACs. The measurements for ODI QC test were made at 95, 105, 110 and 115 cm for the SSD and in all the heights the gantry angle was at the zero degree.
Table 2 shows the results of the ODI QC test for the ELEKTA Precise LINAC and compares them to the calibration rods measurement results as a reference method. The test had been repeated 5 times for each SSD to ponder the precision. Table 3 indicate the same tests for the SIEMENS Primus LINAC. Since the system is completely symmetric, the measurement and results of 0° to 180° are exactly the same as -180° to 0°; therefore, in order to keep the tables legible and as brief as possible, we have only evaluated 0° to 180°.
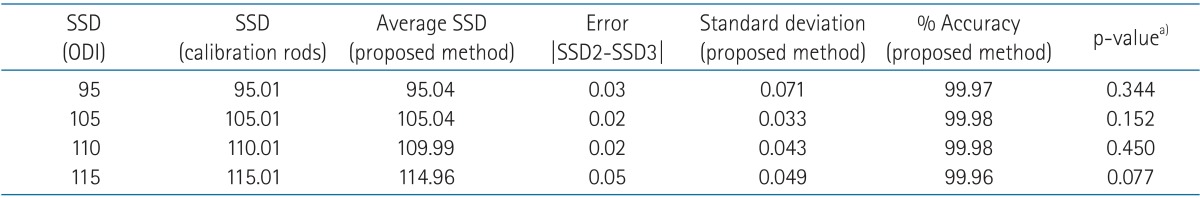
ODI quality control results for ELEKTA Precise comparing the proposed method to calibration rods method

ODI quality control results for SIEMENS Primus comparing the proposed method to calibration rods method
Tables 2 and 3 reveal that the accuracy of the proposed method is 99.96% with a standard deviation of 0.084.
2. Gantry angle QC test
The gantry angle QC test has been done on the same two LINACs at the constant 100 cm SSD and six different gantry angles, 0°, 2°, 5°, 80°, 90°, and 150°. As an ODI QC test, it has been repeated 5 times for each angle to consider the precision. The results for the two LINACs are indicated in Tables 4 and 5.
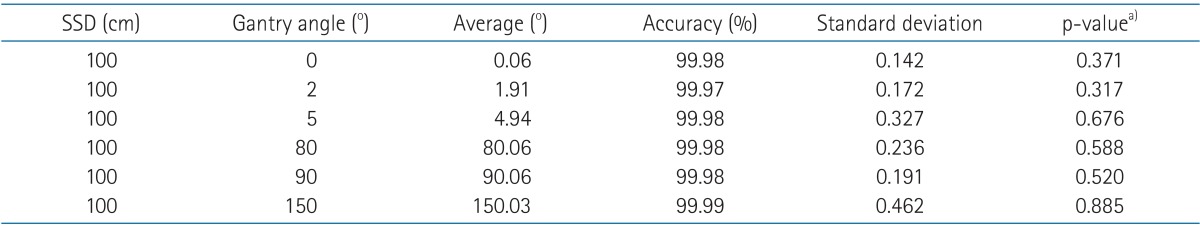
Gantry angle quality control results for ELEKTA Precise with 5 repeats for each angle
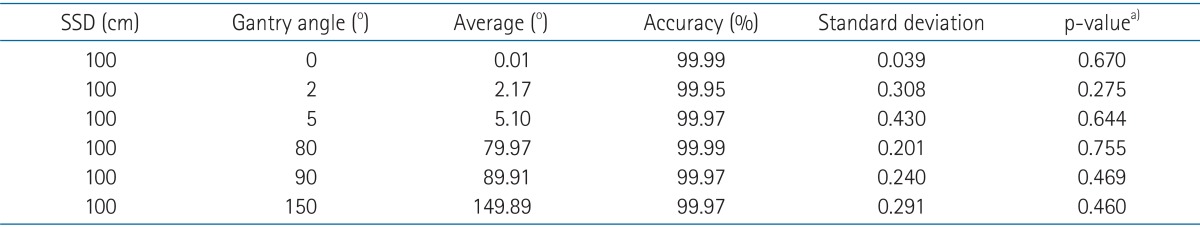
Gantry angle quality control results for SIEMENS Primus with 5 repeats for each angle
According to Tables 4 and 5, the accuracy of the proposed method is 99.95% with a standard deviation of 0.462.
Discussion and Conclusion
The proposed method is used both for ODI QC and gantry angle QC tests.
The simple QA method has high accuracy and precision and consists of a portable camera inserted in the accessory tray and a simple phantom. The proposed method offers a simple way to replace the subjective traditional used methods for ODI and gantry angle QC tests. Currently most of the radiation oncology centers use subjective methods for performing the QC tests, so the accuracy and precision of these conventional and subjective methods cannot be measured, but the proposed methods are totally objective and have precise accuracy and precision which is 99.96% accuracy and 0.084 standard deviation for the SSD QC test and 99.95% accuracy and 0.462 standard deviation for the gantry angle QC test. One thing that makes radiation oncology centers reluctant to follow the complete QC tests is that the tests performed in a traditional way are time-consuming and the centers do not have enough time to spend on them. The objective result of the proposed method takes less than 2 minutes to fix and adjust the camera and phantom and only a click for performing each test, so the total consumed time would not exceed 3 minutes for both of the tests and there would be no problem such as lack of time left for these QC tests.
In conclusion, for the ODI QC test, the accuracy is 99.95% with a standard deviation of 0.061 cm, so it is completely acceptable by AAPM task group 142 which defines a tolerance level of 2 mm for this test [3]. The gantry angle QC test is performed with the same hardware of the ODI QC test and no mentionable part has been added except a few lines of MATLAB code. The result of this test has a precision of 0.43° which is in the acceptable range, defined by AAPM task group 142 that should be less than 1° [3].
Acknowledgments
The authors would like to thank Shahram Bayani, Mohammad Hasan Laki, Mohammadreza Alagheband Hoseini, and Amirhosein Ziaie for their helpful tips and cooperation in the tests.
Notes
Conflict of Interest: No potential conflict of interest relevant to this article was reported.