The effect of photon energy on intensity-modulated radiation therapy (IMRT) plans for prostate cancer
Article information
Abstract
Purpose
To evaluate the effect of common three photon energies (6-MV, 10-MV, and 15-MV) on intensity-modulated radiation therapy (IMRT) plans to treat prostate cancer patients.
Materials and Methods
Twenty patients with prostate cancer treated locally to 81.0 Gy were retrospectively studied. 6-MV, 10-MV, and 15-MV IMRT plans for each patient were generated using suitable planning objectives, dose constraints, and 8-field setting. The plans were analyzed in terms of dose-volume histogram for the target coverage, dose conformity, organs at risk (OAR) sparing, and normal tissue integral dose.
Results
Regardless of the energies chosen at the plans, the target coverage, conformity, and homogeneity of the plans were similar. However, there was a significant dose increase in rectal wall and femoral heads for 6-MV compared to those for 10-MV and 15-MV. The V20 Gy of rectal wall with 6-MV, 10-MV, and 15-MV were 95.6%, 88.4%, and 89.4% while the mean dose to femoral heads were 31.7, 25.9, and 26.3 Gy, respectively. Integral doses to the normal tissues in higher energy (10-MV and 15-MV) plans were reduced by about 7%. Overall, integral doses in mid and low dose regions in 6-MV plans were increased by up to 13%.
Conclusion
In this study, 10-MV prostate IMRT plans showed better OAR sparing and less integral doses than the 6-MV. The biological and clinical significance of this finding remains to be determined afterward, considering neutron dose contribution.
Introduction
The goal of radiation therapy is to deliver a lethal amount of dose to target volumes while sparing the surrounding tissues. Since high-energy photons provide greater penetration depth and skin-sparing effect, conventional principle has been that the deeper the target, the higher energy should be used. Modern technology, especially intensity-modulated radiation therapy (IMRT), allows delivering highly conformal dose distribution near target and saving normal tissue at the same time. However, IMRT is accompanied with significant increase of monitor units (MU), which has led to concerns about a potential risk of radiation-induced malignancies. Higher energy tend to increase more relevant risk because there are greater leakage, scattering, and particularly photo-neutron generation [1]. Moreover, high energy photon generates electrons of longer range, which contribute to wider penumbra than low energy photon [2]. Therefore, it is still unclear whether high-energy IMRT is superior to treating deep-seated tumors such as prostate cancer [3].
In previous works at our institution, the potential to use mixed high- and low-energy IMRT was demonstrated to overcome energy selection problem [4]. In particular, our group has previously reported the feasibility of photon energy modulation techniques [5]. However, these techniques are not appropriate in saving treatment planning labors or not commercially available yet. Thus optimal energy selection for IMRT is still important for implementation in current clinic environment.
It has been reported that beam energy and number of fields on IMRT may result in different planning parameter [6,7]. However, for prostate cancer treatment, there is yet no statistical data to compare normal tissue doses depending on common three photon energies 6-MV, 10-MV, and 15-MV. This study aims to find optimal energy which could offer better target coverage and normal tissue sparing for prostate IMRT. Dosimetric plan evaluations were carried out based on planning target volume (PTV), organ at risk (OAR), as well as integral dose.
Materials and Methods
1. Patient selection
We retrospectively selected 20 patients who had been treated for prostate cancer with IMRT at our institution from February 2008 to August 2010 (IRB number: 1112-005-387).
2. Treatment planning
Treatment planning process was in a same way with previously reported study in our institution [4]. Planning computed tomography slices for each patient were obtained at 2.0-mm slice intervals. The primary PTV (PTVP) was generated by including prostate and seminal vesicles with 1 cm margin toward posterior and inferior regions whereas 2 cm toward others. In addition, a second PTV (PTVB), referred to as boost PTV, was generated by adding a margin of 1 cm around the prostate except for posterior region with smaller margin. Outlined target volumes, normal tissue, and OAR structures including rectal wall, bladder, femoral heads and urethra were transferred to the Eclipse (Varian Medical Systems, Palo Alto, CA, USA) planning system. Instead of the rectum, the rectal wall excluding the rectal contents is defined as an OAR in our institution for accurate evaluation of delivered dose [8].
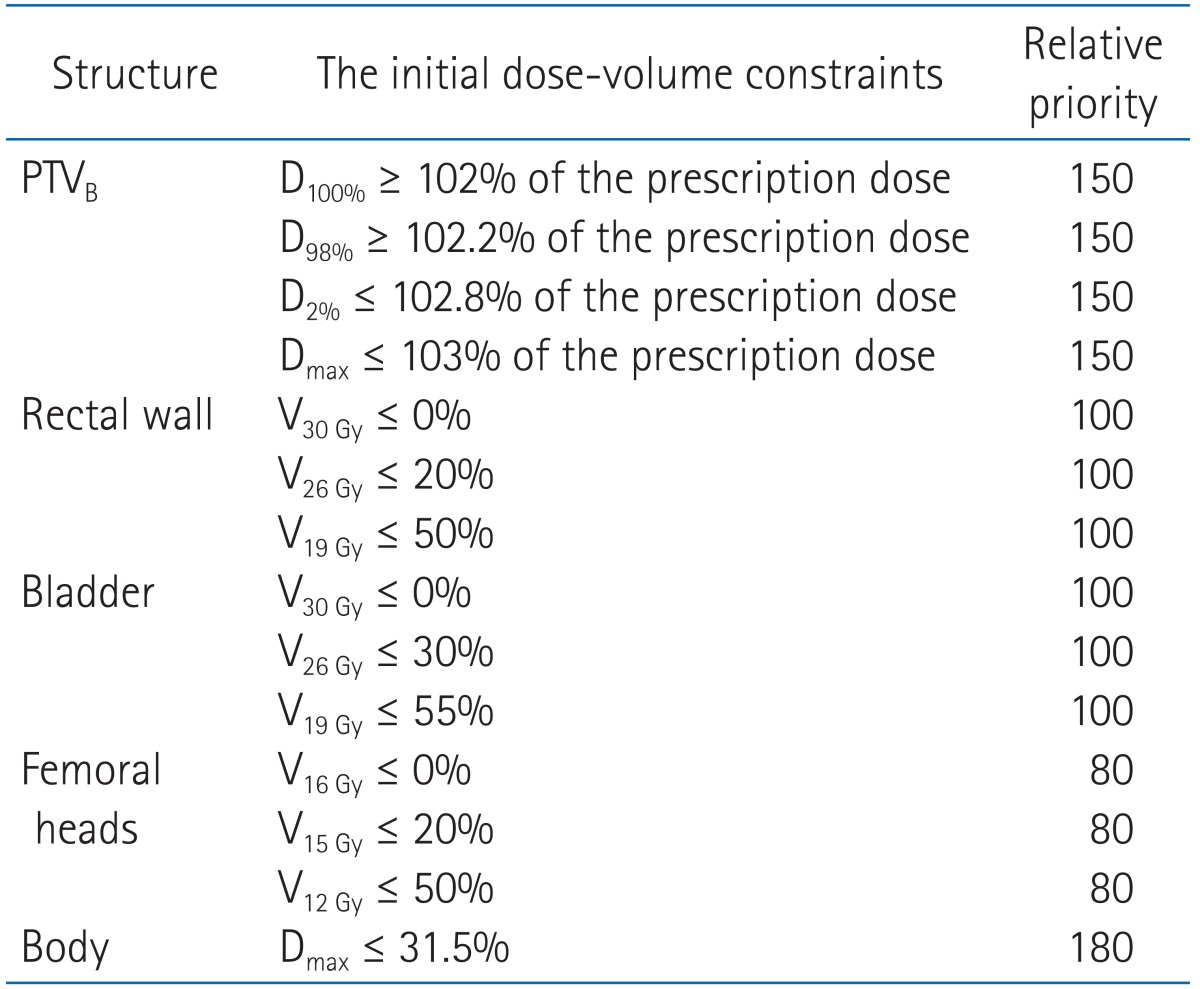
For this study, same target volume, OAR structures, and critical normal tissues dose constraints were used to generate IMRT plans by using an inverse planning algorithm with sliding window technique on the Eclipse planning system. 6-MV and 15-MV treatments were delivered on Varian 21EX (Varian Medical Systems) with a 120-leaf millennium multi-leaf collimator (MLC), while 10-MV treatment was delivered on Varian iX (Varian Medical Systems) with same MLC. The Eclipse treatment planning system uses a 3D pencil beam superposition-convolution algorithm (analytical anisotropic algorithm, AAA; ver. 8.6) for dose calculation with a grid size of 2.5 mm. In order to compare planning results, the same total prescription 81 Gy with a daily dose of 1.8 Gy was applied for each energy planning. The prescription doses of the plans were 50.4 Gy to PTVP and 30.6 Gy to PTVB, respectively. A primary plan for PTVP and a separate boost plan for PTVB were generated for each 6-MV, 10-MV, and 15-MV treatment. The first plan goal was that 95% of the prescribed dose covers at least 95% of the PTV. The second plan goal was that the PTV volume receiving more than 103% of the prescription dose was restricted to zero. As some study has reported [9,10], we found it necessary to perform more stringent dose limits in the process of treatment planning because the initial demands were hardly satisfied during optimization.
All of the initial constraint points and priorities are provided in Tables 1 and 2. We modified constraint points through optimization process to adjust patient specific characteristics but modification was minimized to reduce any bias. Also, any priorities were not altered by a planner for any photon beam energies. We created a pseudo target ring structure with radius of 2 cm and 7 mm apart from PTV to achieve efficient dose gradients around PTV. To minimize high dose in normal tissues and to achieve steep dose slope around PTV, we applied normal tissue objectives. The normal tissue was allowed to receive dose less than 105% but more than 60% and option for dose gradient was set to 0.05. For each of three energies (6-, 10-, and 15-MV photons), eight coplanar fields were used for PTVP by using gantry angles of 40, 60, 100, 160, 200, 260, 300, and 320 degrees. Slightly different gantry angles were applied to PTVB with 30, 65, 95, 165, 195, 265, 295, and 330 degrees. These angles have been commonly utilized in our clinic. For comparison purposes, all plans were normalized such that 95% of the prescription dose covered at least 95% of the PTV. We combined primary and boost plan to generate a sum plan. The single medical physicist performed to generate plans and single radiation oncologist examined plans in its clinical condition.

The initial dose-volume constraints for primary plan
The initial dose-volume constraints for boost plan
3. Comparative evaluation
Dosimetric analysis of different energy IMRT plans was performed by both qualitative and quantitative methods. Target coverage was evaluated according to compare maximum and mean doses to PTVP and PTVB in primary, boost and sum plans. Homogeneity of dose within target volume has been assessed previously by using homogeneity index (HI) as defined by
HI = D5% / D95%
where D5% and D95% represent the dose levels on the dose-volume histogram (DVH) curve corresponding to 5% and 95% of the target volume, respectively. Conformity of high dose around the target has been evaluated by calculating conformity index (CI), as defined by the ratio of the volume of total tissue receiving at least 95% of the prescribed dose to the volume of PTV such that
CI 95% = volume within the 95% isodose / volume of PTV
for PTVP and PTVB from the primary and the boost plans, respectively. The values of CI or HI ideally should be unity. Eclipse system (Varian Medical Systems) provided the gradient measure (GM) indicating dose slope around target for both primary and boost plans. GM was defined by radius difference between the equivalent sphere of prescription and of half-prescription isodose volumes. Thus smaller GM indicates higher dose gradients around the target.
Sparing organ at risk was assessed by comparing the mean doses (Dmean) and irradiated volumes that received at least 70, 66.6, 50, 40 and 20 Gy (V70 Gy, V66.6 Gy, V50 Gy, V40 Gy, V20 Gy) to rectal wall and bladder in sum plans. For the femoral heads, the mean doses (Dmean) and irradiated volumes receiving more than 50, 45, and 30 Gy (V50 Gy, V45 Gy, and V30 Gy) were calculated from the sum plans.
The integral dose (ID) has been defined for n voxels by
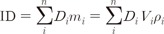
where Di, mi, Vi, ρi are the dose, mass, volume, and density of voxel i. The total ID including the volume of tissues receiving all dose levels were determined on the planning software. The ID receiving a maximum dose of interest were manually summed using DVH differential data which has bins of 1 cGy increments from 0 cGy to given cGy level from 1.0 cGy to half of prescribed dose, 40 cGy. In order to exclude high dose conformity around PTV, we analyzed the ID at dose levels such as V<1 Gy, V<2 Gy instead of conventional parameters, V>1 Gy, V>2 Gy, and so forth. Note that density of each voxel is considered as pure water (1 g/cm3).
4. Statistical analyses
Analyses were performed by using a paired t-test to determine dose-volumetric differences for 6-MV vs. 10-MV, 6-MV vs. 15-MV, and 10-MV vs. 15-MV plans. Differences were considered statistically significant at p ≤ 0.05.
Results
1. Target coverage
A quantitative analysis was carried out to compare DVH, homogeneity index and the target coverage parameter such as Dmax and Dmean (Table 3, Fig. 1). Homogeneity indices were similar in primary plans (1.05, 1.05, and 1.06 for HI of 6-MV, 10-MV, and 15-MV, respectively). The boost plans of 6-MV beams showed a slightly better target dose homogeneity than both 10-MV and 15-MV beams, but the HI value were similar in the three groups (1.04, 1.05, and 1.06 for HI of 6-MV, 10-MV, and 15-MV, respectively). No clear differences of maximal and mean dose to target were observed among 6-MV, 10-MV, and 15-MV plans. The mean doses to PTVB in higher energy tend to be more or less higher but it is negligible (29.83, 30.01, and 30.14 for Dmean of 6-MV, 10-MV, and 15-MV, respectively). The mean doses to PTVp and PTVB in 6-MV sum plans were slightly lower than the others but the differences were not large.
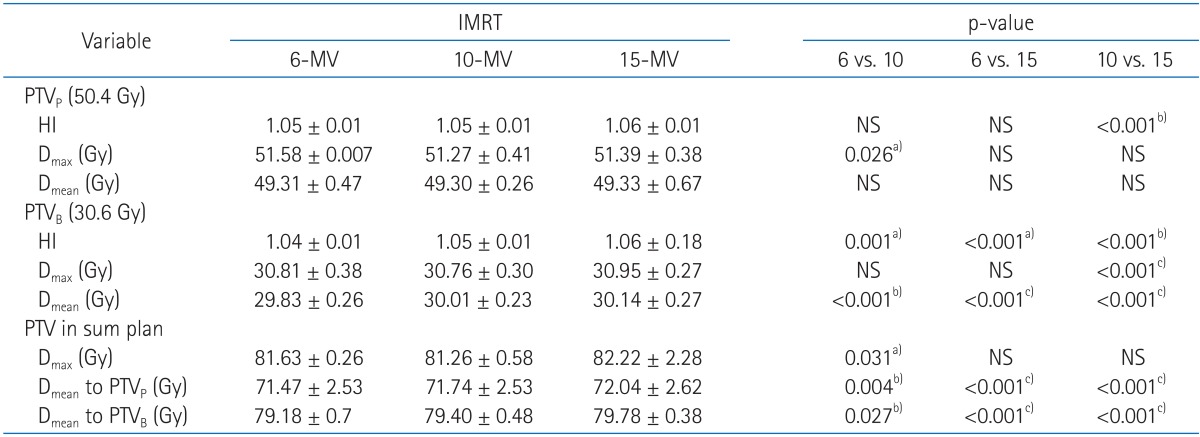
Target coverage
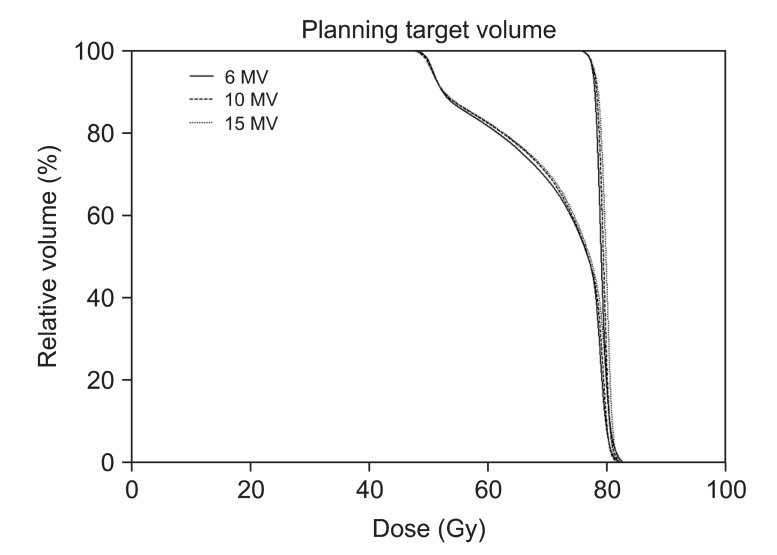
Dose volume histograms (DVHs) for the primary and boost planning target volumes (PTVs) from sum plans are shown. The solid lines indicate DVHs of intensity-modulated radiation therapy with 6-MV photon beams. Between two solid lines of DVHs, one which receives higher dose is DVH for the boost PTV and the other is DVH for the primary PTV. Dashed lines and dotted lines indicate DVHs from 10-MV and 15-MV, respectively. No clear differences are observed among three types of plans.
2. Target conformity and sparing organ at risk
For both primary and boost plans, lower energy achieve slightly better target conformity (Table 4). 10-MV beams (relative to 15-MV) showed 1% improvement on target conformity from 1.05 to 1.04 for primary plan and 1.10 to 1.09 for boost plan, respectively. Conformity around the boost plan using 6-MV was also improved for 1%. However, there were no significant differences on target conformity between three energies.
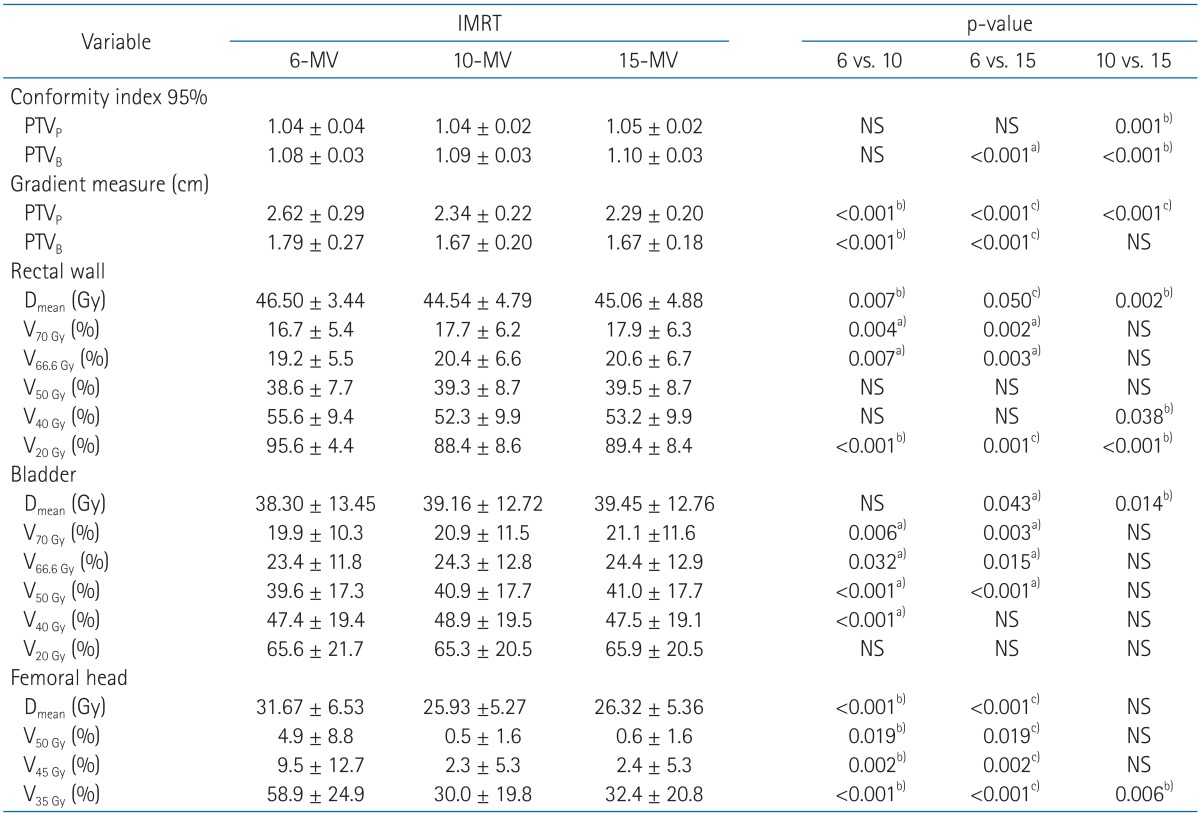
Normal tissue sparing in sum plan
It was shown that the value of GM in 6-MV plans were higher for both primary and boost plans than 10-MV and 15-MV, implying that on average 6-MV plans made less sharp dose gradient around PTV.
The mean dose to the rectal wall was reduced with 10-MV compared to 6-MV and 15-MV plans. Even though rectal wall volumes receiving ≥70, 66.6, and 50 Gy were smaller with 6-MV than others, the volumes covered by 40 and 20 Gy isodose were on average smaller for 10-MV compared with others. The rectal wall sparing advantages with higher energy is more obviously shown in the Fig. 2.
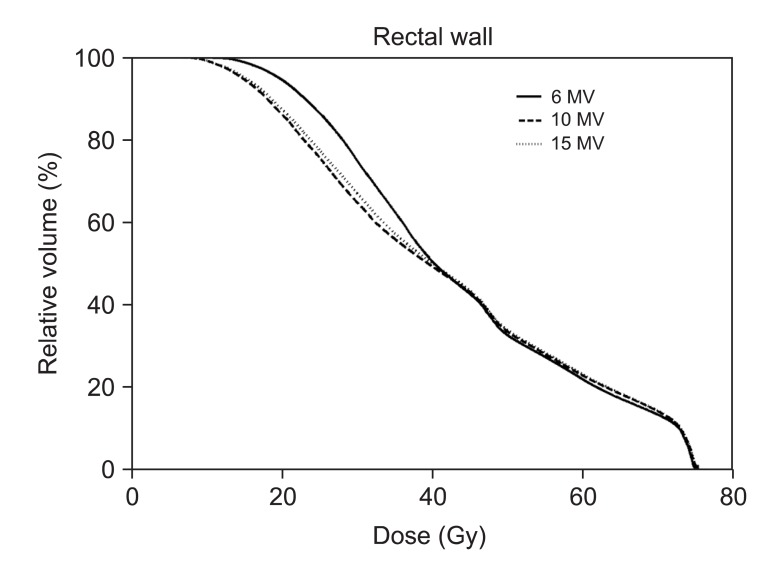
Dose volume histogram (DVH) for rectal wall is shown. The solid lines indicate DVHs of intensity-modulated radiation therapy with 6-MV photon beams while dashed lines and dotted lines indicate DVHs of intensity-modulated radiation therapy with 10-MV and 15-MV, respectively. Intensity-modulated radiation therapy with 6-MV spares slightly more rectal wall in high dose regions but 10-MV and 15-MV save significantly more in low dose regions.
The 6-MV beam achieved slightly less mean dose to bladder than 15-MV beam (2.9%) but showed no statistical improvement compared with 10-MV. For bladder, the volumes receiving ≥70, 66.6, 50, 40, and 20 Gy were smaller with 6-MV than others, however, the amount of increased volume were less than 3% on average. Mean DVH curve of bladder (Fig. 3) clearly shows that there are only negligible differences between three types of energy.

Dose volume histogram (DVH) for bladder is shown. The solid lines indicate DVHs of intensity-modulated radiation therapy with 6-MV photon beams while dashed lines and dotted lines indicate DVHs of intensity-modulated radiation therapy with 10-MV and 15-MV, respectively. No clear differences among three types of plans are observed.
The 6-MV mean dose to femoral head was reduced by 18% with 10-MV beam and 17% with 15-MV. The 6-MV plans resulted in significantly larger volumes of femoral head receiving ≥50, 45, and 35 Gy compared with higher energies. Significant differences of DVH were found between 6-MV and higher energies (Fig. 4).

Dose volume histogram (DVH) for femoral heads is shown. The solid lines indicate DVHs of intensity-modulated radiation therapy with 6-MV photon beams while dashed lines and dotted lines indicate DVHs of intensity-modulated radiation therapy with 10-MV and 15-MV, respectively. It indicates that intensity-modulated radiation therapy with 6-MV delivers higher dose to femoral heads than the others.
3. Integral dose of normal tissue
Evaluation of the ID on normal tissue showed that there was increased ID of any normal tissue volume using 6-MV IMRT technique (Table 5). As compared with 6-MV, higher energy IMRT techniques actually decreased the ID by 2.1-7.7% for 10-MV and 2.2-8.8% for 15-MV. Even though statistical analysis found differences between 10-MV and 15-MV, their ID differences were only 0.7% on average. When comparing individual patients using 10-MV vs. 15-MV, 10-MV has even led reduction in ID of 2 patients (1.7% and 0.3%) whereas ID was decreased by no more than 1.5% in 18 patients with 15-MV IMRT.

Integral dose (ID) of total normal tissue
We conducted further analysis of normal tissue ID receiving less than 40 Gy (Table 6). Importantly, 10-MV and 15-MV achieved smaller ID than 6-MV in 2.0-15.0 Gy and 35.0-40.0 Gy region. The 6-MV IMRT seems to have advantages to reduce ID in the mid-dose region (20.0-30.0 Gy). However, as shown in slow slope in the mid-dose region of DVH (Fig. 5), it is because 6-MV IMRT relatively makes less volumes receiving around 20 Gy. The ID from other dose regions was significantly increased by 6-MV IMRT with an average increase in ID of 0.01-12.74% and absolute increase in ID of up to 8.69 × 10³ Gy · cm3
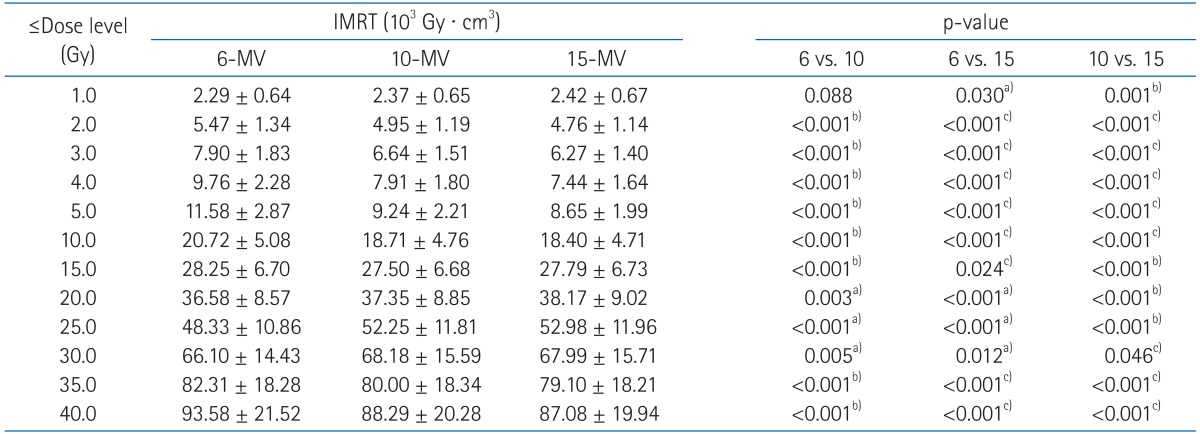
Integral dose (ID) of normal tissue in the low to mid-dose region
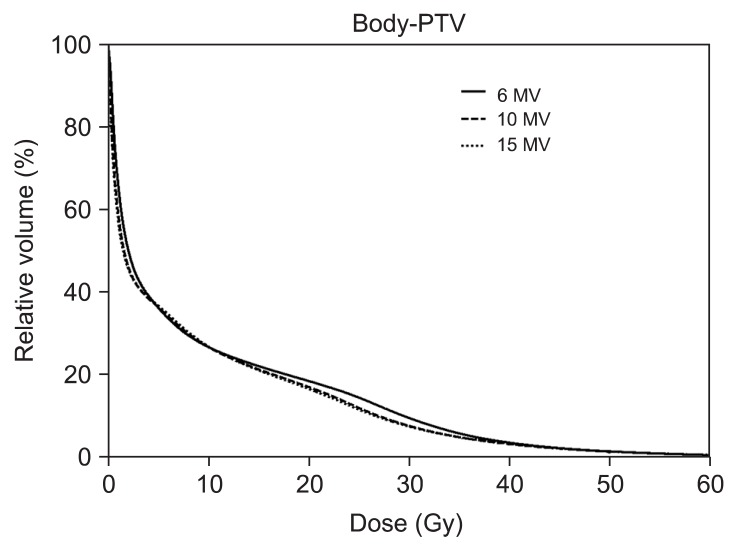
Dose volume histograms (DVHs) for normal tissue (body-planning target volume [PTV]) from sum plans are shown. The solid lines indicate DVHs of intensity-modulated radiation therapy (IMRT) with 6-MV photon beams while dashed lines and dotted lines indicate DVHs of IMRT with 10-MV and 15-MV, respectively. DVH for normal tissue shows that IMRT with 6-MV delivers higher dose in the region from 10 to 40 Gy.
Discussion and Conclusion
For deep-seated tumor treatment, basic teaching has been that high energy photon is more suitable than low energy photon because of its better penetrating power, skin sparing effect, conformity on PTV, and less normal tissue doses. However, there have been debates about high energy usage for deep seated tumor treatments in IMRT [6]. Soderstrom et al. [11] showed that there is little need to select beam energy in multi-fields IMRT technique. This finding was supported by recent planning studies [12]. These planning studies argued that there were very little differences in mean DVH of both PTV and OAR between 6-MV and 15-MV [13] and also statistically no significant differences between 6-MV and 18-MV, except MU [12]. However, unlike these studies, experiences within our group suggested that there in fact be a change of dose distribution depending on IMRT photon energy. We did compare stringent OAR dose distributions for rectal wall (instead of whole rectum) and for femoral head. Radiation oncology society has known about femoral head importance for plan comparison [14,15]. Moreover, to the best of our knowledge, there was no statistically supporting data to compare integral dose differences in the three photon energies. This study showed that 6-MV IMRT treatment led to increase the integral dose significantly without considering neutron contamination.
Pirzkall et al. [6] found a significant impact of energy selection on the dose distribution. Interestingly, our results brought up the similar finding with Pirzkall et al. [6]. They did not provide sufficient statistical data to verify disappearance of high energy benefits with many fields but our study found that, even with many fields, high energy advantages over low energy would not be negligible.
It can be argued that the results here are only exceptional to our planning system and difficult to be generalized for other circumstances. Since each planning system uses different dose-volume constraints, optimization algorithms, internal options and commercial linear accelerator, it is hardly reproducible to generate the same plans as in this study. However, if the same planning parameters are used, then the further results can be used to validate or refute the reported results here.
Neutron generation associated with high energy photon is of concern because of its substantial contribution to dose equivalent [1,16,17]. However, Kry et al. [17] estimated negligible neutron contribution at 10-MV although neutron contributed considerable portion by using more than 15-MV energy photon. Monte Carlo simulation has even reported that the risk of secondary malignancy may not be as large as previously reported when treatment energies were 18-MV [18]. Moreover, a study of Hussein et al. [19], which conduct photon and neutron measurements considering complication calculation, attempted to address 15-MV energy IMRT benefits outweighing risk.
In conclusion, for prostate IMRT, the use of 6-MV with many fields (8 fields) can result in an increase in doses of OAR and normal tissue. Hence high-energy photons, especially 10-MV photon known to generate negligible neutron dose equivalent, should be considered in IMRT technique. However, the biological and clinical significance of this suggestion remains to be determined afterward.
Notes
No potential conflict of interest relevant to this article was reported.