


Introduction
High-dose (>70 Gy) radiotherapy (RT) for localized prostate cancer requires careful consideration of target position changes and the state of adjacent organs-at-risk (OARs), such as the rectum and bladder. Previous studies have shown that interfractional displacement of the prostate gland can vary from 0 to 20 mm due to the changes in the rectum and bladder filling [1-8]. Changes in rectal volume can increase the risk of biochemical and local failure [1,9-14]. An increase in rectal volume receiving ≥60 Gy can elevate the risk of grade ≥2 rectal toxicity, including rectal bleeding, pain or discomfort during bowel movements, diarrhea, and incontinence [15-20]. The occurrence of acute and late gastrointestinal and genitourinary complications can limit prescription dose escalation.
Image-guided radiotherapy (IGRT) is crucial in minimizing daily uncertainties in delivering the dose to the target and protecting adjacent OARs by matching patient setup with reference images [21-24]. In addition, the daily in-room imaging enables daily evaluation of delivered doses to the target three-dimensionally [25]. However, radiation-based in-room imaging techniques such as megavoltage (MV) or kilovoltage (kV) cone beam computed tomography (CBCT) or MV fan beam CT have limited image quality due to the physical principles of image acquisition and the need for real-time fast imaging or minimization of additional radiation dose associated with imaging [26]. Therefore, evaluating the patient's dose, considering their daily internal condition, is mainly carried out by utilizing the high-quality simulation kVCT image that has been adjusted to align with the organ structure of the daily CT image [27]. In the last 10 years, three adaptive radiation therapy (ART) platforms—Ethos (Varian Medical Systems, Palo Alto, CA, USA), MRIdian (ViewRay Inc., Mountain View, CA, USA), and Unity (Elekta AB, Stockholm, Sweden)—have been introduced for clinical application. These platforms utilize onboard imaging-based deformable auto-segmentation of structure sets [28]. However, the accuracy of deformable image registration (DIR) depends on factors like the interface areas of deformation, the transformation framework (asymmetric or symmetric), the registration algorithm, and the mapping direction (forward or backward) [29]. Furthermore, auto-contouring based on DIR can lead to incorrect results in specific situations, such as image artifacts and substantial positional or volumetric changes in regions-of-interest (ROIs) [30]. As a result, manual adjustments might be necessary for these outcomes, potentially consuming a significant amount of time. Additionally, the implementation of online ART carries the risk of unintended modifications to the treatment plan, thereby increasing the demand for radiation oncologists to evaluate and approve plans in real-time [28].
Therefore, in practical terms, monitoring interfractional organ variations for individual patients by contouring ROIs directly on the low-quality daily CT images and notifying the medical staff if the degree of variation exceeds a certain tolerance can be an additional option for efficiently implementing ART within conventional RT platforms. However, manual delineation of the target and OARs on low-quality images can be prone to observer variability and too time-consuming to be repeated on each daily image in clinical practice, especially for institutions with limited manpower.
Recent studies have shown that artificial intelligence (AI)-driven technology can effectively reduce the workload in time-consuming, repetitive tasks [31-35]. In the clinical practice of RT planning, AI-based accurate OAR auto-contouring is crucial to establish an efficient workflow by standardizing contouring criteria while reducing workload. Several commercial solutions, such as Therapanacea Annotate (TheraPanacea, Paris, France), AccuContour (Manteia Technology, Xiamen, China), AI-Rad Companion (Siemens Healthineers, Erlangen, Germany), Contour ProtégéAI (MIM Software Inc., Cleveland, OH, USA), and OncoStudio (OncoSoft Inc., Seoul, South Korea), have been developed and globally distributed for AI-based auto-segmentation using planning CT (kV fan beam CT) without user interaction. Consequently, these advancements have brought about significant changes in the clinical workflow within the field of radiation therapy practice. In a recent study by Chung et al. [36], the clinical performance of AI-based auto-segmentation was evaluated using 180 abdominopelvic kVCT images. The dataset comprised a training set of 91.7% and a validation set of 8.3%, and the study involved the participation of ten radiation oncologists specializing in gynecologic cancer from six different institutions [36]. The findings indicated that medical staffs who were part of this project were predominantly content (7 out of 10) with the AI-based auto-segmentation, which led to a reduction of 30 minutes in contouring time and an enhancement in consistency across institutions [36]. Nonetheless, the current commercial software options lack AI models for auto-segmentation on low-quality daily CT images. Among the various software available, the OncoStudio software has a feature that allows its user to train and test the AI model integrated into OncoStudio, utilizing user-defined datasets for research purposes.
We anticipate that an autonomous AI-driven system designed for the automated tracking and alerting of interfractional patient conditions will enhance treatment quality in institutions with limited manpower resources. If this AI-driven solution can (1) automatically segment low-quality daily CT images, (2) analyze the patient's internal condition structurally based on the state depicted in the simulation kVCT image, and (3) notify the medical staff through messaging if the degree of variation exceeds the pre-defined tolerance, it may help to establish an efficient workflow to provide instructions for adaptive treatment planning. This study aimed to evaluate the feasibility of using a commercial AI-based solution to auto-segment MVCT images for interfractional monitoring of organ changes in RT for prostate cancer.
Materials and Methods
1. Preparation of MVCT dataset
We selected 100 prostate cancer patients who received RT using TomoTherapy system (Accuray Inc., Madison, WI, USA). During the IGRT process, the MVCT images were acquired in a supine position. Patients were instructed to urinate for 1–1.5 hours before treatment. However, strict adherence to this protocol was not enforced. Additionally, no other bladder-filling training was provided. To ensure patient setup alignment with the reference kVCT image used for treatment planning, MVCT imaging was performed by aligning with the three-dimensional (3D) bony structure and subsequently adjusting the couch to the optimal position. The MVCT scan range was set from the sacral promontory level to the lower margin of the ischium and was partially adjusted based on the bladder volume. This scan range was maintained consistently for MVCT imaging six times during each patient's RT course. The MVCT images were collected with a slice resolution of 6 mm in the scan direction, and 22–34 slices were obtained for each patient treatment, focusing on the bladder volume and its dose distribution, regardless of the total prescription dose. Two radiation oncologists manually contoured the body outline, the bladder including prostate area (Blad+Pros), and the rectal balloon on the MVCT images using the OncoStudio software. The prostate and bladder are quite challenging to distinguish, even in high-quality kVCT images, as they are closely adjacent and exhibit similar densities. Therefore, it is advantageous to delineate the prostate volume using magnetic resonance images fused with the simulation kVCT images during conventional RT planning. Consequently, the differentiation between the prostate and bladder in low-quality MVCT images becomes even more demanding. Our study aims to monitor relative changes in ROIs by reviewing daily CT images based on the patient's internal condition as depicted in the kVCT images. Therefore, we opted to review the combined prostate and bladder volumes for segmentation on the MVCT images to assess whether there are simultaneous meaningful relative changes in both volumes. When contouring the body outline, the segmentation by the image intensity (Hounsfield unit [HU]) threshold might be an option in the autonomous segmentation system. However, it sometimes encounters limitations unexpectedly due to image artifacts, increased noise levels, or the presence of a treatment table, immobilization devices, implants, etc. Therefore, we included the body outline as a target segmentation ROI. To train the AI model with appropriate hyperparameters (i.e., empirically determined settings through multiple trials), we analyzed and compared the image intensity distribution in each ROI on the MVCT image with that of the kVCT image using MIM Maestro version 7.1.4 software. Compared to kVCT images, using MVCT images for contouring ROIs can produce uncertain results among different observers [37]. To ensure consistency in contouring, the initial contouring was performed by one radiation oncologist without prior patient information, followed by a subsequent review by another oncologist. Fig. 1 illustrates the image fusion process between the simulation kVCT image and MVCT images and a comparison of ROIs in the MIM software.
2. Training condition of a commercial AI model
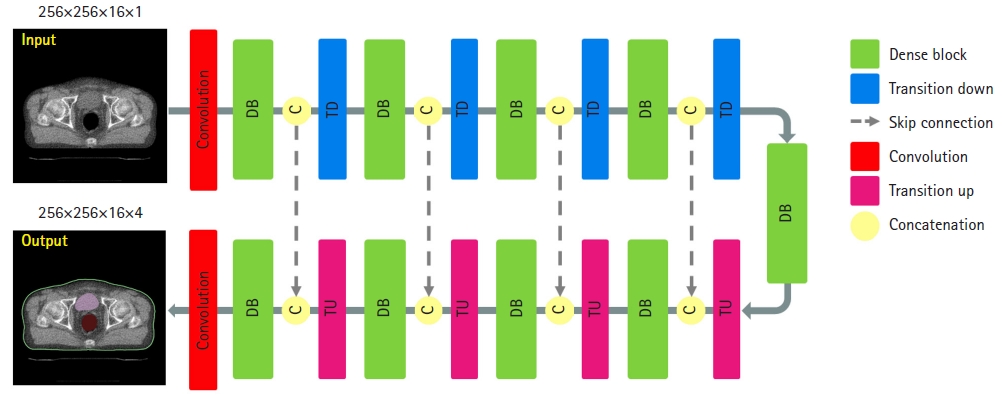
The OncoStudio software is a commercially available AI-based auto-segmentation tool that enables automatic detection and segmentation of CT images without human intervention. The software employs a convolutional neural network (CNN) based on a U-Net structure combined with a 3D version of fully convolutional DenseNet (FC-DenseNet) as the backbone (Fig. 2) [38]. To input into the CNN, all cases were resampled to a voxel spacing of 2 mm in the x- and y-directions and randomly resampled in the z-direction to a voxel spacing between 1 mm and 5 mm, and the image intensity values (HU) were linearly normalized into the range of [0, 1], with a truncated range of [-200, 350]. Due to GPU memory limitations, the CNN was trained on a patch level with a 3D patch size of 256 × 256 × 16 from the volumetric CT images and output the 3D patch of multi-label segmentation. The CNN was trained using the sum of cross-entropy and dice loss, with an Adam optimizer [39] and an initial learning rate of 2 × 10⁻⁴. Data augmentation techniques, such as randomized crop, random intensity shift by 70 HU, random zoom scaling by 0.2, and random blurring by 0.3, were employed during training to reduce overfitting and improve generalization. The AI model was trained on two 24 GB Quadro RTX A5000 GPUs (NVIDIA, Santa Clara, CA, USA). Out of a total of 100 MVCT and contoured datasets, 80 MVCT datasets were utilized for training, 10 datasets were allocated for validation, and another 10 datasets were reserved for independent testing. The above training condition was set empirically, showing the successful performance in MVCT segmentation.
3. Performance evaluation metrics
The dice similarity coefficient (DSC), which is the most commonly used metric for evaluating image segmentation, was used to compare the results of automatic segmentation using an AI model with manual segmentation during the training process. The DSC was calculated based on the overlap area between the predicted and ground truth regions, and a well-trained model would achieve a higher DSC score (i.e., Dice score), which is defined as follows:
The overlap area between the predicted region A and the ground truth region B is multiplied by 2 and divided by the sum of regions A and B, which can also be defined using the true positive (TP), false positive (FP), true negative (TN), and false negative (FN) components of the confusion matrix. In general, in AI training, the loss is trained to decrease. Since a higher Dice score indicates better performance, the loss function is usually implemented using the formula below by taking the negative value of the Dice score. As the two regions become more similar, the Dice score approaches 1, and the Dice loss approaches 0, which can be interpreted as a well-trained model.
We utilized not only the Dice loss but also a dual cross-entropy loss [40] to expedite the optimization of the AI model during the training process in OncoStudio. As a result, the overall loss values shown in the AI model did not converge to 0 and exhibited negative values. When evaluating the precision of segmentation, the Hausdorff distance, which indicates the maximum distance difference between two contour surfaces, is commonly used as an assessment metric. However, for this study, which aims to detect anomalies through tracking overall relative errors rather than local errors within the ROI, the mean surface distance (MSD), capable of showing how much, on average, the surface varies between two contour surfaces, was employed as the evaluation metric. The formula for calculating MSD is as follows:
where, S and S' represent the outer surfaces of two segmentations, d(p,S') denotes the distance between a point p on surface S and the surface S', which is calculated as the minimum of the Euclidean norm: min p ' ∈ S ' p - p ' 2
This study used the rigid registration function of MIM Maestro version 7.1.4 software to fuse kVCT and MVCT images based on bony structures rather than utilizing the real image alignment information used in each treatment session, as illustrated in Fig. 1. The ROIs, namely, body outline (blue lines), rectal balloon (brown lines), and Blad+Pros (pink lines) of the kVCT images, segmented during the RT planning process, served as a reference for analyzing changes in the centroid positions (x, y, and z in mm) and volumes (mL) of the ROIs within each MVCT image. Additionally, to evaluate the consistency of MVCT image quality, changes in the mean and median image intensities (HU) of each ROI were analyzed with reference to those assessed in the first MVCT image. During the comparative analysis of the body outline region, only the contours within the fused area with the MVCT images from the entire region of the kVCT image were used.
Results
1. Analysis of MVCT and kVCT images
The image intensity of a CT image refers to the level of brightness or darkness of a pixel in a CT image, which is determined by the amount of X-ray absorption by the tissues within the body. The areas of the body that absorb more X-rays appear brighter on the CT image, while areas that absorb fewer X-rays appear darker. The image intensity can be adjusted by changing the window width and window level, which are settings that control the range of pixel values displayed on the image. By adjusting these settings, specific tissues or structures of interest can be highlighted, and the visibility of subtle abnormalities can be improved.
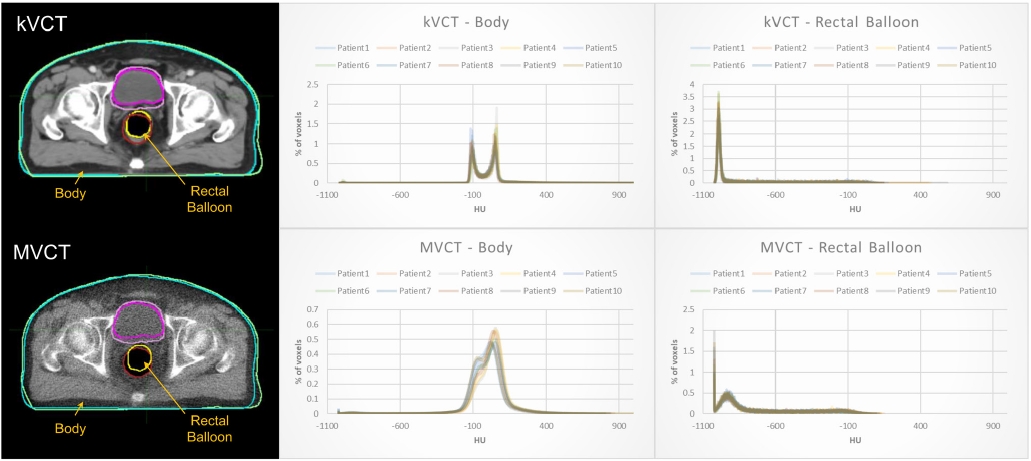
The MVCT images were acquired using high-energy X-rays up to 3.5 MV [41,42], which penetrate deeper into the body and are primarily used for imaging bony structures and implanted devices, while the kVCT images were acquired using kilovoltage X-rays up to 120 kVp, which are better suited for imaging soft tissue. Compared to kVCT images, MVCT images exhibit higher noise levels and lower contrast and spatial resolution. Fig. 3 illustrates the clear differentiation of bone, soft tissue, and cavity regions in kVCT images, leading to a sharp distribution of image intensity values (HU) within the contoured body outline and rectal balloon volumes. However, the distributions in MVCT images were relatively blunt. The HU distributions in the kVCT and MVCT images were analyzed using the “contour histogram” and “statistics for contour” functions implemented in MIM Maestro version 7.1.4 software. For the body outline volume, the HU distribution in the kVCT image showed two sharp peaks near -100 HU and 60 HU, respectively, within the range of -135 HU to 120 HU. In the MVCT image, however, two blunt peaks were formed near -70 HU and 50 HU, respectively, within the range of -200 HU to 350 HU. For the rectal balloon volume, the HU distribution in the kVCT image showed a sharp peak mostly centered at -995 HU, while the peak distribution was relatively wider and centered at -930 HU in the MVCT image. The mean HU ± standard deviation of the body outline volume for kVCT and MVCT images for 10 patients was 14.4 ± 176.8 and 10.7 ± 151.7, respectively, while the mean HU ± standard deviation for the rectal balloon volume was -825.5 ± 298.4 and -711.3 ± 291.3, respectively.
2. Training result of FC-DenseNet model
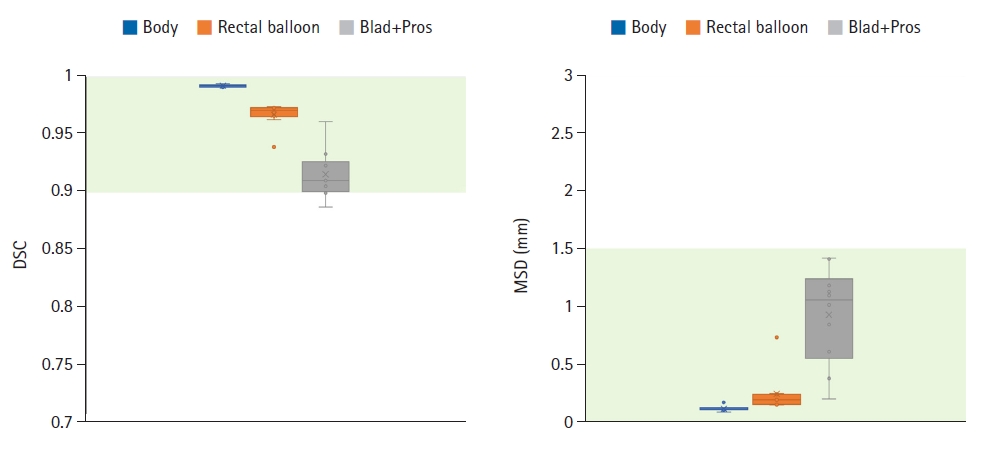
Fig. 4 shows the training result of the FC-DenseNet model implemented in the OncoStudio software, using 80 MVCT image sets of 80 patients and manually segmented datasets. As the Dice score approached 1, the loss value (the gold line) decreased exponentially. The loss gradually decreased and stabilized over time. By epoch 100, the validation set's loss value had been reduced from the initial -4.55 to the final -4.80, confirming the effectiveness of the training. DSC and MSD metrics were employed to compare AI-generated auto-contours against manual contours for 10 test datasets to evaluate the AI model's auto-segmentation performance in MIM Maestro version 7.1.4 software. As depicted in Fig. 5, the DSC and MSD scores for the body outline, rectal balloon, and Blad+Pros regions were all over 0.88 and within 1.43 mm, respectively. Specifically, for the body outline, the mean DSC value was measured at 0.992 ± 0.001 (min–max, 0.991–0.994), alongside the MSD value of 0.117 ± 0.022 mm (min–max, 0.088–0.171). Regarding the rectal balloon, the mean DSC value was observed at 0.967±0.011 (min–max, 0.939–0.974), and, while the MSD value was recorded as 0.245 ± 0.176 mm (min–max, 0.150–0.737). For the Blad+Pros, the corresponding DSC values was 0.915 ± 0.021 (min–max, 0.887–0.961), while the associated MSD value was 0.932 ± 0.418 mm (min–max, 0.200–1.426).
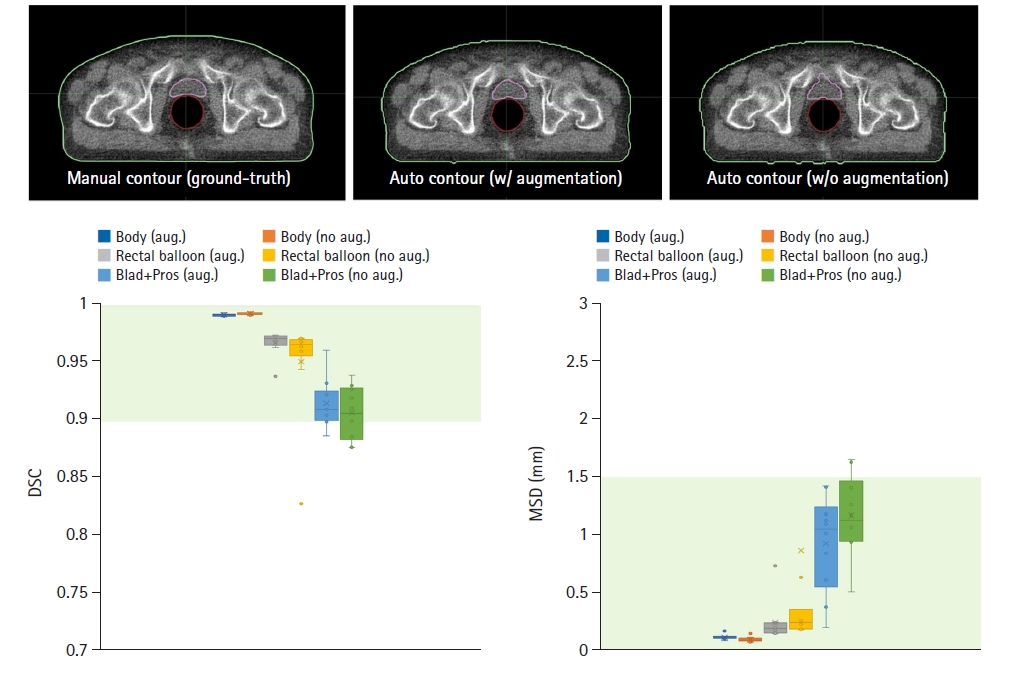
When training FC-DenseNet without applying data augmentation techniques and using the same dataset, DSC and MSD metrics were evaluated on the same ten MVCT datasets for testing. As depicted in Fig. 6, in the absence of data augmentation, the minimum DSC values for body outline, rectal balloon, and Blad+Pros decreased to 0.83, while the maximum MSD increased to 6.31 mm. In detail, evaluating the AI-generated auto-contours against manual contours, the mean DSC values for the body outline was 0.994 ± 0.001 (min–max, 0.992–0.995), with the MSD value of 0.097 ± 0.023 mm (min–max, 0.069–0.149). The mean DSC value for the rectal balloon was 0.951 ± 0.044 (min–max, 0.828–0.971), with the MSD value of 0.871 ± 1.917 mm (min–max, 0.180–6.313). For Blad+Pros, the mean DSC value was 0.907 ± 0.023 (min–max, 0.877–0.940), with the MSD values of 1.173 ± 0.346 mm (min–max, 0.512–1.664).
3. Analysis of interfractional MVCT images
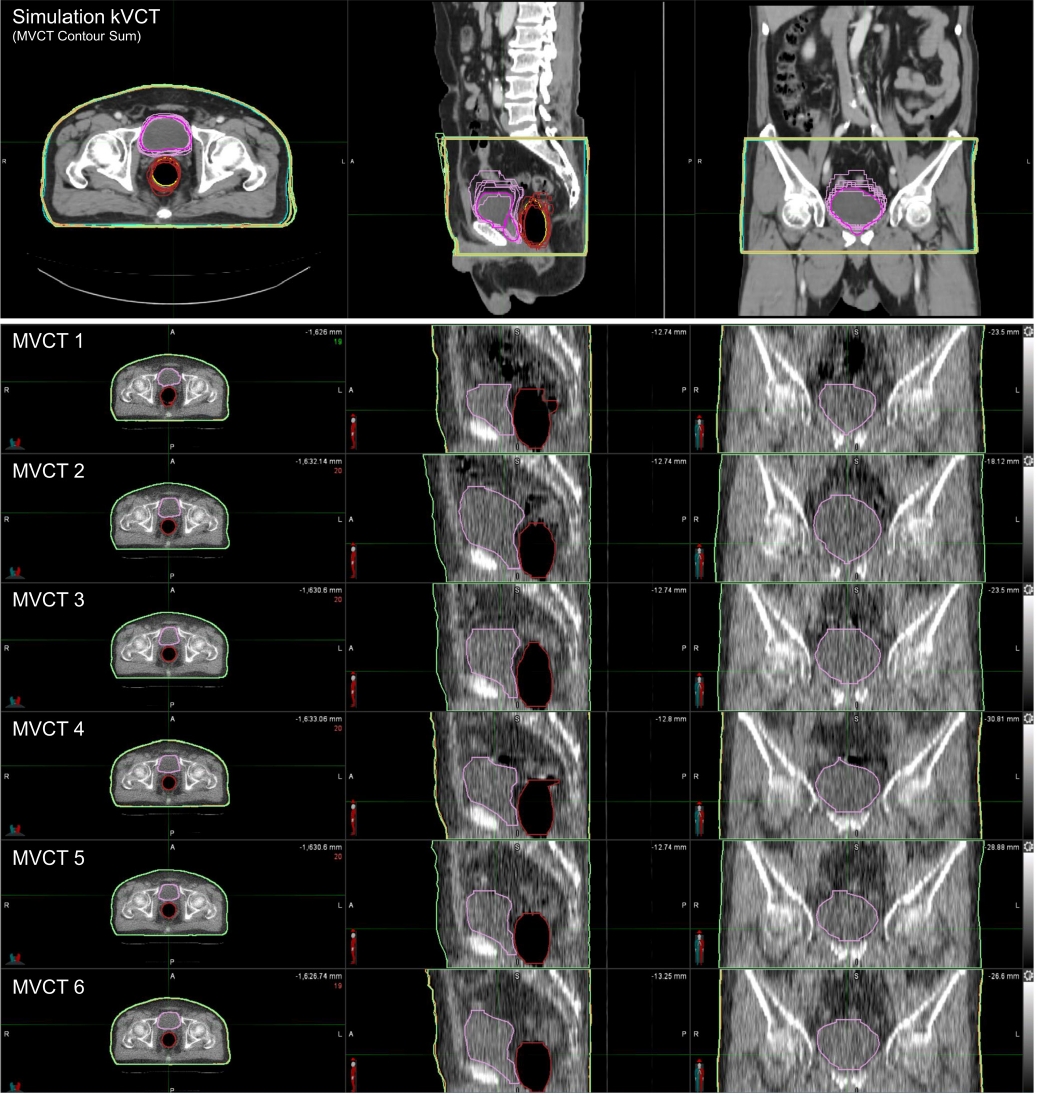
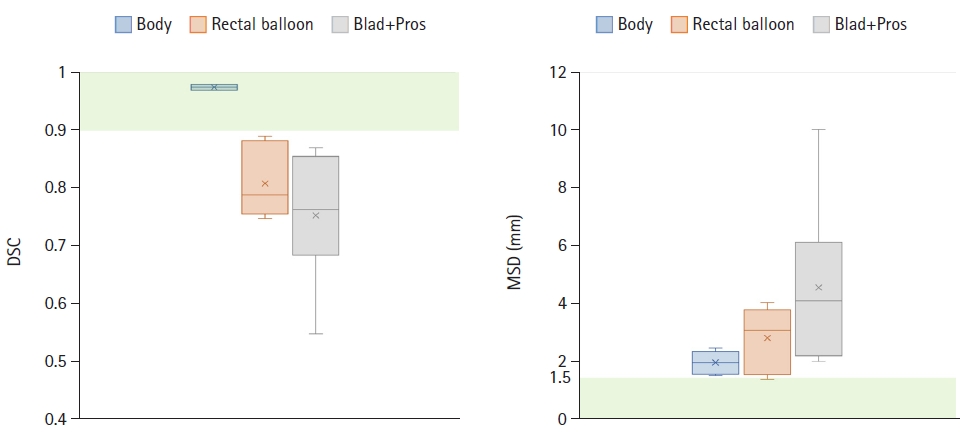
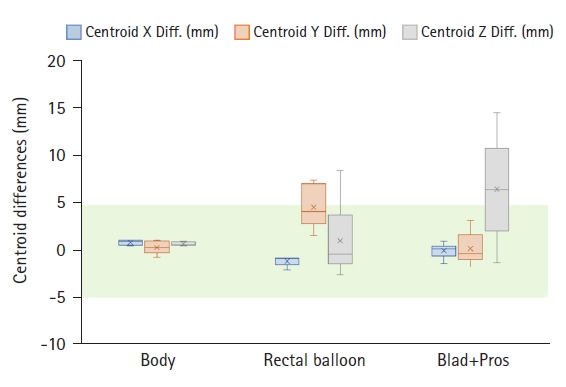
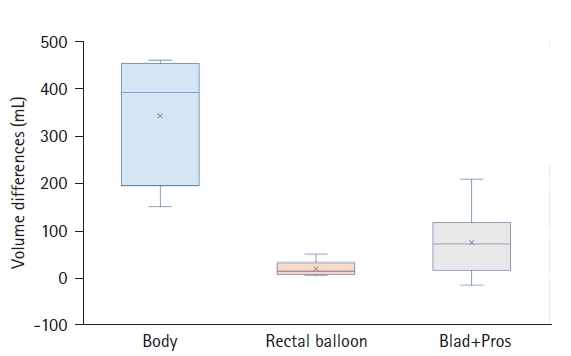
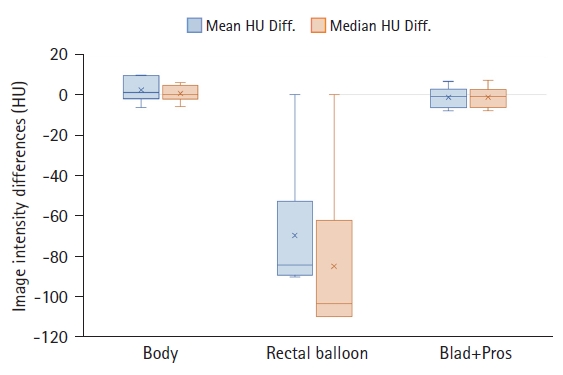
Fig. 7 compares six MVCT images acquired for IGRT of a randomly selected prostate cancer patient. In the simulation kVCT image of Fig. 7, all ROIs segmented from six MVCT images are overlaid, allowing for a rough observation of the patient's internal structural changes. To quantitatively compare and analyze these changes, as shown in Figs. 8–10, the DSC, MSD, centroid differences, and volume differences were analyzed in the six MVCT images based on the ROIs in the kVCT image. For the body outline, the DSC was above 0.97, MSD was within a maximum of 2.48 mm, and the centroid differences were all within 1.20 mm along the x, y, and z axes, indicating good agreement. However, in terms of volume, differences of up to 460 mL were observed in the last MVCT image. For the rectal balloon, the mean DSC was 0.81 ± 0.06 (min–max, 0.75–0.89), the mean MSD was 2.83 ± 1.09 mm (min–max, 1.40–4.05), and centroid differences were within 2.10 mm along the x-axis (with a mean of 1.03 ± 0.56 mm), 7.60 mm along the y-axis (with a mean of 4.72 ± 2.31 mm), and 8.60 mm along the z-axis (with a mean of 1.13 ± 3.98 mm). Volume differences of up to 48 mL (with a mean of 17.96 ± 16.61 mL) were observed for the rectal balloon. For the Blad+Pros region, the mean DSC was 0.75 ± 0.11 (min–max, 0.55–0.87), the mean MSD was 4.56 ± 2.93 mm (min–max, 2.02–10.04), and centroid differences were within 1.30 mm along the x-axis (with a mean of 0.08 ± 0.80 mm), 3.30 mm along the y-axis (with a mean of 0.30 ± 1.76 mm), and 14.80 mm along the z-axis (with a mean of 6.63 ± 5.49 mm). Volume differences of up to 208 mL (with a mean of 74.01 ± 76.14 mL) were observed for the Blad+Pros region. The intensity (HU) of MVCT images was quantitatively analyzed for variations in the remaining five MVCT images based on the initial MVCT image, as depicted in Fig. 11. For the body outline and Blad+Pros regions, the mean HU differences were within 8.04 ± 5.26 HU and 9.51 ± 6.17 HU, respectively, and the median HU differences were within 8.00 ± 5.35 HU and 6.00 ± 4.18 HU, respectively, indicating no significant observed changes. However, the average and median HU differences were relatively largely fluctuated for the rectal balloon, within 90.36 ± 34.92 HU and 110.00 ± 42.82 HU, respectively.
Discussion and Conclusion
This study aimed to assess the feasibility of commercial software in establishing a system that can track interfractional patient organ changes using low-quality MVCT images, possibly enabling ART efficiently. This is particularly important in terms of cost-effectiveness. This research evaluated the feasibility of utilizing the AI model in OncoStudio for the automated segmentation of ROIs in low-quality MVCT images.
To ensure stable auto-segmentation performance during the training of the FC-DenseNet model in OncoStudio, we established a successful training condition through trial and error. These included factors such as dataset composition and quantity, voxel spacing, 3D patch size, data augmentation conditions, image intensity (HU) range, and learning rate. DenseNet, which connects all layers densely using dense connectivity patterns, has been known for its remarkable performance and low computational requirements compared to other architectures. In the training process of this model, growth rate and model depth were set to 16 and 5, respectively, corresponding to the settings used for training the auto-segmentation model on the kVCT image in the OncoStudio. While we initially trained the model on 259 datasets from 23 patients, we found that increasing the number of patients significantly impacted model performance. To achieve stable results, we determined that a minimum of 100 patients was required. However, due to data limitations, 80 patients were used for training, 10 for validation, and 10 for testing, and it was ensured that the images used for training and validation were not utilized in testing. For the voxel spacing in the training process, while the initial training was performed with a fixed z-axis spacing of 3 mm, 1 mm-interval random sampling of 1–5 mm spacing was determined for more precise training considering variations in MVCT scan slice thickness (2–6 mm) and the complex 3D volume structure. In this case, when the 3D patch size was set to 384 × 384 × 16 under the condition of a 2 × 2 × 3 mm3 resolution, the training speed decreased and memory usage increased, but there was not a significant impact on segmentation performance. Therefore, the training process was conducted with a 3D patch size of 256 × 256 × 16, which allowed it to encompass the entire body region. To augment the dataset, factors such as variations in image quality such as image intensity (HU) distribution and noise level that affect image sharpness and blurring, and organ size due to patient anatomy were taken into account to determine the contrast range (HU), the random intensity (HU) shift, the random zoom scaling, and the random blurring. The learning rate should be set to a suitable value to ensure stable training with increased epochs. Through trial and error, it was found that a learning rate of around 2 × 10⁻⁴ was appropriate to prevent sudden increases in loss and convergence to zero DSC values during training. By optimizing the training conditions through these processes, the AI model produced outcomes that closely matched those obtained through manual segmentation, as depicted in Fig. 5. Data augmentation is crucial to ensure the stability of the model performance due to the lower image quality of MVCT images compared to kVCT images. A larger dataset comprising more than 100 patients is necessary to achieve further improvements beyond the developed model. This expansion is anticipated to potentially raise overall DSC above 0.9 and maintain MSD within 1 mm.
We observed slight changes (up to 9.51 HU) in the image intensities (HU) of the six MVCT images, as depicted in Fig. 11, with the exception of the rectal balloon. These changes are expected to have a minimal impact on auto-segmentation performance due to the application of random HU shifts (within a range of 70 HU) during data augmentation. However, in the case of the rectal balloon, the blurred image quality at the boundary between the rectal wall area and the air layer can result in variations in the proportion of tissue invasion within the segmented ROI. As previously reported in the literature [37], determining the ROI boundaries is highly uncertain due to the poor image quality of MVCT images. The uncertainty can be further pronounced when the rectum is filled with gas due to physiological phenomena. This is a limitation inherent in the auto-segmentation of low-quality MVCT images.
In a previous study by Shelley et al. [43], an auto-segmentation model for the rectum in MVCT images of prostate cancer patients was developed. This model was based on the Chan-Vese algorithm and implemented in MATLAB. They trained the model using 26 MVCT images from 10 prostate cancer patients and validated it with 30 additional MVCT images. The performance of this model resulted in a DSC of approximately 0.78 when comparing auto-contours against manual contours. Although the rectum's structure is more intricate than the ROIs utilized in this study, making direct comparison challenging, our results demonstrated the superior performance of the auto-segmentation model (FC-DenseNet) regarding the DSC score, achieving a DSC score above 0.88 for the Blad+Pros region.
While monitoring the patient's internal condition through six MVCT scans, the DSC values for both the rectal balloon and Blad+Pros regions scored below 0.9. The MSD values were up to 4 mm and 10 mm, respectively, indicating significant variations in the shape and volume of the ROIs. Additionally, disparities in centroid positions were noted, with the rectal balloon and Blad+Pros areas showing differences of up to 8.6 mm and 14.8 mm along the z-axis, respectively. The presence of gas in the patient's rectum due to physiological factors could contribute to an increased segmentation volume in the superior direction of the rectal balloon. Similarly, variations in bladder filling could lead to notable changes in the superior direction of the Blad+Pros region. In clinical practice, online image registration for IGRT primarily focuses on aligning with the positions of the prostate and rectal balloon, particularly in regions receiving the highest radiation doses. This approach contrasts with the rigid registration outcomes between MVCT and kVCT based on bony structures, as employed in this study using MIM software. Given these considerations, the variations observed in the y- and z-axes direction of the rectal balloon in this study could be relatively reduced during actual treatment scenarios. However, even if rectal balloon position variations were minimized, whole-body centroid shifts would still occur, which might necessitate the conventional DIR-based approach for patient dose estimation if we are concerned.
The changes in bladder volume and abdominal body volume vary from patient to patient due to individual conditions. Factors like meals, fluid intake, and timing of urination are quite challenging to control, especially in elderly patients. This study observed trends where the body outline and Blad+Pros volumes changed by up to 460 mL and 208 mL, respectively. However, at present, determining the threshold for adaptive planning based on these changes remains difficult. Therefore, accumulating patient tracking data for a larger patient population and statistically analyzing the impact of varying degrees of changes in each ROI on the patient's internal dose distribution is required further. This will help determine levels of risk for significant changes, requiring the medical staff's confirmation, in MSD, centroid position, and volume.
In conclusion, we have verified the feasibility of utilizing a commercial AI-based model for auto-segmentation with low-quality daily MVCT images. Additionally, this approach facilitates effective interfractional tracking of organ changes during RT. Our future objective is to establish an automatic system capable of swiftly and accurately segmenting all ROIs within the daily MVCT images. Moreover, if any segmentation errors are identified, we aim to rectify them within a 5-minute.